Projects
 |
EviGuiDe – Embedding the Evidence Information in Computer-Supported Guidelines into the Decision-Making ProcessIn this project we propose a methodology that supports guideline users during the decision-making process on the basis of a semi-formal representation of the evidence information that can be found in Clinical Practice Guidelines (CPGs). A semi-formal representation is required to handle evidence information in computer-interpretable guideline representation languages. For this purpose, we have developed a meta schema that covers various kinds of grading systems including graded and ungraded evidence informaton. |
| |
EviX – Facilitating Evidence-based Decision Support Using Information Extraction and Clinical GuidelinesThe goal of the proposed project is the experimental application and further development of promising approaches in the area of semi-automatic creation of computer-interpretable clinical guidelines and the execution of evidence-based recommendations. We expect contributions to ease the creation of computer-interpretable guidelines and support of the medical staff in their daily routine and decision-making. |
| |
EXPAND: EXploratory Visualization of PAtent Network DynamicsThe distributed nature of modern research and development has lead to a highly differentiated knowledge and technology landscape, which forms the complex and continuously evolving environment for individual and organizational actors in the economy, science, and technology realm. Public patent databases, which are regulating these developments by ongoing accumulation of semi-structured patent documents, are a rich source of information that has not been sufficiently leveraged for synoptic science and business analytical tasks yet. |

|
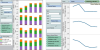
FinanceVis - Design and Evaluation of Visualization Methods to Compare Multivariate Time SeriesThe comparison of several stocks against each other is an important task in financial analysis. The data is usually compared by juxtaposition or by superimposition. But even a large enough difference between the price ranges can make a simple comparison of the data difficult. Stock market data is not limited to stocks. It also includes stock (market) indices such as the Dow Jones and NASDAQ. Stock indices have their own proprietary unit, which is different to the unit of a stock. Time series which have different units are also called heterogeneous data. |
| |
FishEye JTreeThe Java Swing element "JTree" allows representation and navigation in tree structures. But as soon as the amount of hierarchical data structures increases (e.g. the file system) one can easily lose overview and orientation while navigating through different nodes on deep hierarchic levels. |

|
Guideline Overview Tool (GOT)The main purpose of the Guideline Overview Tool (GOT) is to provide a compact overview that is easy to read and comprehend in order to support physicians in executing and analyzing therapies with clinical guidelines. This overview has two main functions: |

|
HorizonVis – Interactive Visual Exploration of Multivariate Medical Measurements in Diabetes CareMultivariate, time-oriented data plays a central role in many domains such as medicine, finance, or environmental engineering. Information Visualization can be an instrument to make such vast datasets intuitively comprehensible. As the number of time series increases, visualizations need to be space-efficient. Horizon graphs [Reijner, 2008] are an innovative approach to reduce required space by dividing the a chart into bands and layering these. |
| |
HypoVis: Modeling Hypotheses with Visual Analytics MethodsThe primary goal of Visual Analytics is the close intertwinedness of human reasoning and automated methods. Our goal in HypoVis is the design and development of a Visual Analytics process that uses the inherent structure contained in time-oriented data as a way to improve the integration of human reasoning. This structure can, for example, be seen in the calendar aspect of time being composed of smaller granularities, like years and seasons. Our focus is the generation of models from hypotheses, consisting of bringing the hypotheses into an automated system, and validating it. |
| |
ImagePlus + ManageCategories for MediawikiManageCategories: Categorizing Articles without Knowledge of Wikimarkup. ImagePlus: Adding / Manipulating of Images using without Knowledge of Wikimarkup using HTML Objects. |
| |
in2vis - Interactive Information Visualization: Exploring and Supporting Human Reasoning ProcessesUsers are confronted with a huge amount of abstract, but highly structured data. They want to accomplish different kinds of tasks, where they need different interactions and navigations as well as different views of the same data to gain more insight into the data under investigation. These processes of investigation are very complex and only little guidance exists. Therfore our aims are |
|
InfoVis Tools - A Detailed Comparison of Information Visualization Tools Using a Reference Data SetMany approaches to solve the problem of visualizing time-oriented data have been published in recent time, creating the need to categorize not only the methods to visualize time-oriented data but also the information visualization tools available on the market. Because of the difficulty of comparing such tools no agreement on a common categorization has been reached. This master's thesis uses a recently published categorization to perform a detailed comparison of several visualization tools, focusing on the temporal aspects of data. |

|
InfoVis:Wiki - the Information Visualization community platformUsing editable-by-anyone Wiki technology turned out to be the only way of keeping the presented information up to date and knowledge exchange vivid. |
| |
iUMLS – A Program to Enlarge and Modify Output of MetaMapiUMLS provides an API to enhance, modify, and serialize the output of the MMTx program. |
| |
KAVA-Time |
| |
LASSIE – modeLing treAtment proceSSes using Information ExtractionModeling clinical guidelines and protocols in a computer-interpretable format is a challenging, but burdensome and time-consuming task. Existing methods and tools to support this task demand detailed medical knowledge, knowledge about the formal representations, and a manual modeling. Furthermore, formalized guideline documents mostly fall far short in terms of readability and understandability for the human domain modeler. |
| |
MapFace - A Graphical Editor for MetaMap Transfer (MMTx)
|

|
MetaDataEditor - Collecting and Storing Medical Metadata
MetaDataEditor uses a prototypical XML-based framework which allows gathering following metadata concerning: |

|
MobiGuide: Guiding Patients Anytime EverywhereMobiGuide (MG) will develop a patient guidance system that integrates hospital and monitoring data into a Personal Health Record (PHR) accessible by patients and care providers and provide personalized secure clinical-guideline-based guidance also outside clinical environments. MG's ubiquity will be achieved by having a Decision Support System (DSS) at the back end, and on the front end by utilizing Body Area Network (BAN) technology and developing a coordinated light-weight DSS that can operate independently. Personalization will be achieved by considering patient preferences and context. Retrospective data analysis will be used to assess compliance and to indicate care pathways shown to be beneficial for certain patient context. |
| |
NegHunter – Negation Detection in Medical Documents Using Syntactical MethodsNegHunter is a program to detect negated concepts in medical documents using syntactical methods. |

|
OncoCure - Information and Communication Technologies for Clinical Governance in OncologyThe general aim of the project is to use innovative ICT-based methods and models for clinical governance in oncology, by designing and developing a system for supporting and controlling the best evidence-based oncological care process. The system is based on electronic guidelines and recommendations and will be integrated with clinical information systems (CIS) to manage the oncological patients. |
| |
PDF2Table – Utilizing Table PatternsIf we surf the web we can find PDF files in heaps. Once technical details of an amazing five mega pixel digital camera, once a statistic about the last two years incomes of an enterprise, and once a brilliant crime novel of Sir Arthur Conan Doyle is saved in a PDF file. The widespread use of this file format takes the focus on the question of how to reuse the data in such a file. Many things are already done in this area. For example, there are several tools that convert PDF-files to other formats. |

|
PlanViewer - Treating Temporal Uncertainties of Complex Hierarchical Data Visually
The visualization was developed with two open-source toolkits: The InfoVis Toolkit and Prefuse. The InfoVis Toolkit provides a memory saving data table used to store abstract data, prefuse is the base framework for all graphical issues. The application was developed in the scope of a thesis about temporal uncertainties in plans. Generally, there are three ways on how to treat temporal uncertainties: |
| |
polycube - Towards Integrated Mental Models of Cultural Heritage DataWeb-based databases of museums’ and cultural institutions’ collections enable fast access to important cultural assets for everyone: Millions of paintings, sculptures, music, and artworks can be reached with only a few clicks. Current research shows that interested visitors like to explore digital collections - often without a concrete goal. They like their observations to add up and make sense and to learn something new. |
| |
ReMine |
| |
Smart Communities and Technologies (SmartCT)Cities are ever-evolving, complex cyber physical systems of systems covering a magnitude of different areas. The initial concept of a smart city started with cities utilizing communication technologies to deliver services to their citizens and evolved to using information technology to be smarter and more efficient about the utilization of their resources. In recent years however, information technology has changed significantly, and with it the resources and areas addressable by a smart city have broadened considerably. They now cover areas like smart buildings, smart traffic systems and roads, autonomous driving, energy hubs, electric car utilization, water/waste and pollution management, as well as concepts like urban farming. Therefore, we must enable an open adaptive interconnected approach that is able to incorporate new areas on demand overcoming potentially limiting compartmentalization. Smart cities exchanging their capabilities in an organic elastic manner, being able to address whatever challenge and opportunity they face with the expertise, data, and knowledge of a global network of expert stakeholders form the basis of our vision for an Internet of Cities. Our central focus is to create the scientific underpinnings for a future Internet of Cities infrastructure. We will create a comprehensive set of methodologies, models, and tools for design, development, management, and evolution of next-generation smart city applications. |