in2vis - Interactive Information Visualization: Exploring and Supporting Human Reasoning Processes

Our aims are
- to explore and to compare different methods (Information Visualization, Exploratory Data Analys and Machine Learning) to ease the understanding (the human reasoning process), to find their strengths and limitations and to estimate how combinations of these methods can contribute to more in-depth reasoning processes; and
- to develop guidelines how to explore and visualize data and information task- and user- appropriately.
- Silvia Miksch
- Klaus Hinum
- Wolfgang Aigner
- Margit Pohl
- Markus Rester
- Sylvia Wiltner
- Christian Popow
- Susanne Ohmann
- Insitute of Software Technology & Interactive Systems, Vienna University of Technology
- Institute of Design and Assessment of Technology, Vienna University of Technology
- Department of Child and Adolescent Neuropsychiatry, Medical University Vienna
This work is funded by the Vienna Science and Technology Fund (WienerWissenschafts-, Forschungs- und Technologiefonds - WWTF), grant WWTF CI038.
Users are confronted with a huge amount of abstract, but highly structured data. They want to accomplish different kinds of tasks, where they need different interactions and navigations as well as different views of the same data to gain more insight into the data under investigation. These processes of investigation are very complex and only little guidance exists. Therfore our aims are
- to explore and to compare different methods (Information Visualization, Exploratory Data Analys and Machine Learning) to ease the understanding (the human reasoning process), to find their strengths and limitations and to estimate how combinations of these methods can contribute to more in-depth reasoning processes; and
- to develop guidelines how to explore and visualize data and information task- and user- appropriately.
To fullfill these aims we will conduct a study with medical data from Department of Child and Adolescent Neuropsychiatry at the Medical University of Vienna. This highly structured, time based, categorical data comes from questionnaires of girls with eating disorders (anorexia nervosa).
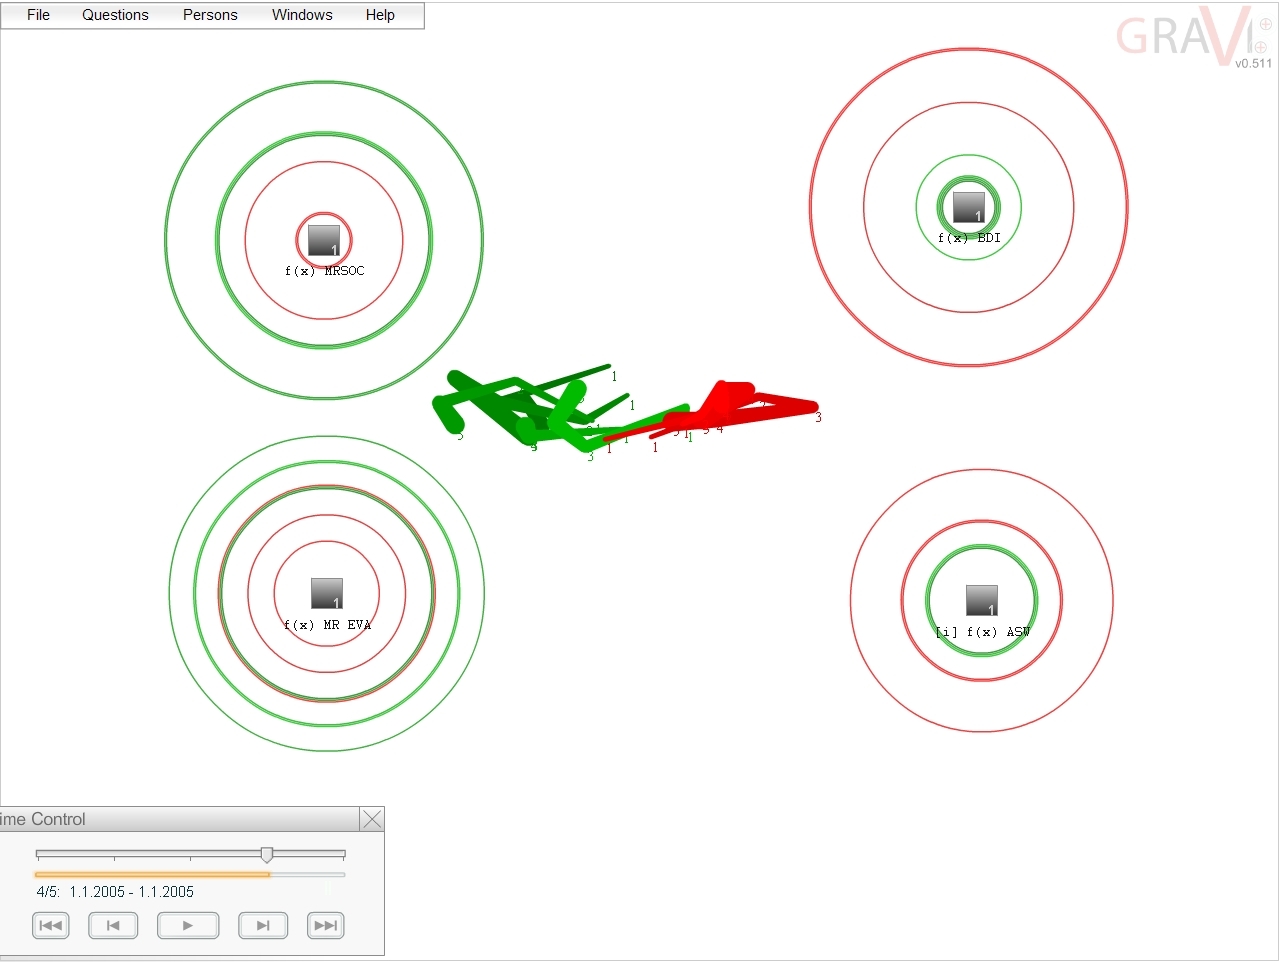
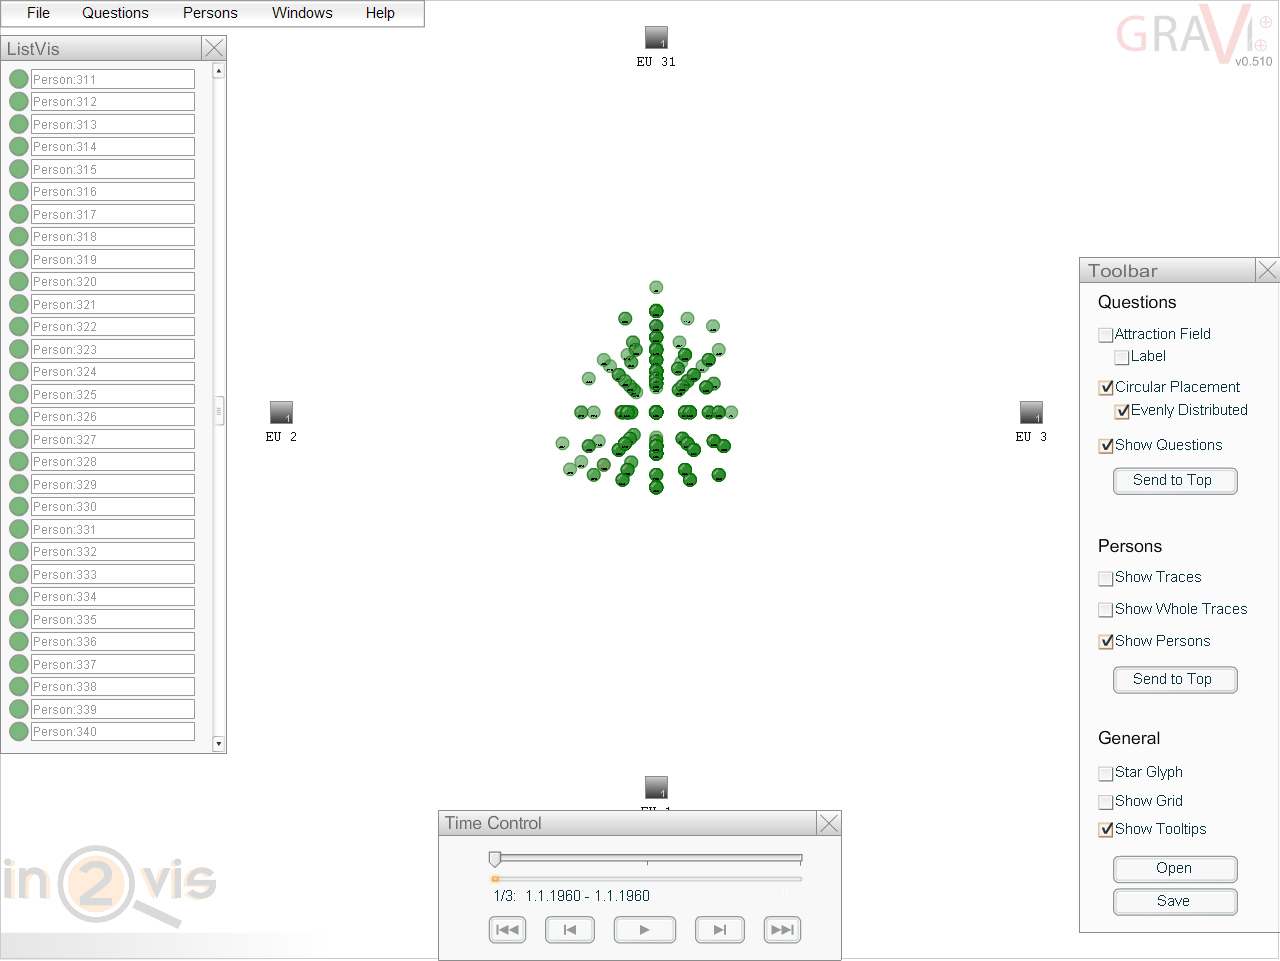
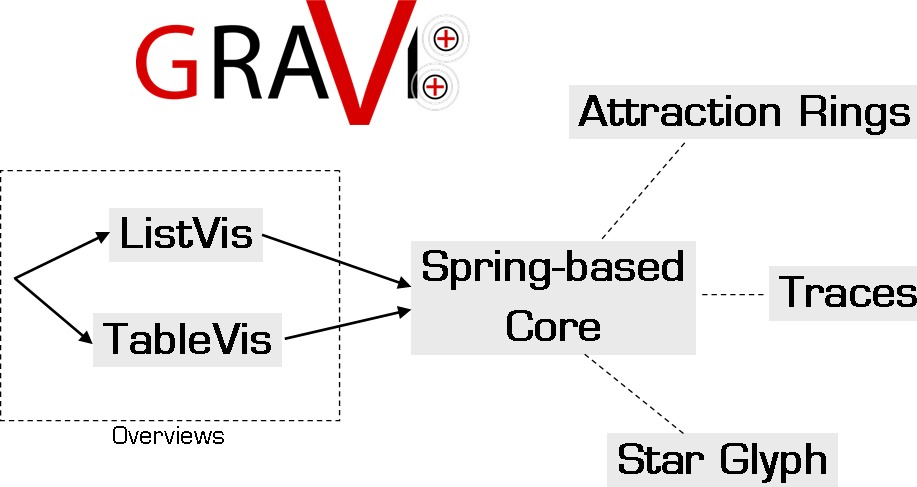
![]() A new exploratory information visualization named Gravi++ was developed in the course of the in2vis project as the information visualization method of the study. This method was designed for our medical data and is able to help the user analyse the data and predict further development of the patients. It integrates a spring-based core visualization to display the multidimensional data set. To cope with the temporal dimension, we integrated animation and an additional view called Traces that maps the animation on a single image. Furthermore, the Star Plot view, Attraction Rings view, and the tooltips can give information on the exact values of each dimension. In addition to this, we added two overview visualizations called ListVis and TableVis to handle larger amounts of data and enable the user to select a subset. The different views are coordinated using linking and brushing and provide many different interaction possibilities.
A new exploratory information visualization named Gravi++ was developed in the course of the in2vis project as the information visualization method of the study. This method was designed for our medical data and is able to help the user analyse the data and predict further development of the patients. It integrates a spring-based core visualization to display the multidimensional data set. To cope with the temporal dimension, we integrated animation and an additional view called Traces that maps the animation on a single image. Furthermore, the Star Plot view, Attraction Rings view, and the tooltips can give information on the exact values of each dimension. In addition to this, we added two overview visualizations called ListVis and TableVis to handle larger amounts of data and enable the user to select a subset. The different views are coordinated using linking and brushing and provide many different interaction possibilities.
To get more information on the usefulness of Gravi++ we conducted an extensive evaluation of our visualization. The first step was a usability evaluation to preclude that usability problems are mixed up with problems with the visualization method as such. After that we conducted an insight study, where we wanted to find the strength and limitations of supervised Machine Learning (ML) techniques, Exploratory Data Analysis (EDA), and Gravi++ for our problem domain. It indicates that Gravi++ is a very good method for analyzing this kind of data and that using ML, EDA and visualization methods in conjunction will very likely contribute to a deeper comprehension of the data to explore.
|
Stage |
Method |
Subjects |
Aim |
Collected Material |
|
Usability |
usability inspection |
1 usability expert |
spot most obvious glitches |
31 usability problems |
|
heuristic evaluation |
27 semi-experts |
in depth testing |
447 reports documenting |
|
|
focus groups |
additional usability assessment |
no new problems BUT |
||
|
Insight Study |
insight reports |
33 domain novices |
patterns of insight & |
876 reports documenting |
|
log files |
used vis. options & |
56055 log file entries |
||
|
focus groups |
relativize findings & |
transcription of 3x 100min |
||
|
Case Study |
interviews |
2 real users |
feasibility & usefulness |
transcription of 1x 60min |
|
thinking aloud |
notes on 1x 180min |
|||
|
Transferability |
interviews |
14 experts |
usefulness in other domains |
transcription of 14x 60min |
Different steps in our extensive evaluation study.
Publications