Projects
| |
ArtVis Dynamic Network Perspectives on Digital Art HistoryIn order to better understand the history of art a major challenge of Digital Art History (DAH) is to understand how the components of the art system (persons, objects, places, institutions, and events) interacted with each other and how these interactions vary over time. The aim of our project is to model such complex relations through the use of Network Visualization (NetVis). Networks have a wide range of application in many domains, including social sciences, software engineering, and economics. |
| |
Bilateral Artificial Intelligence - Cluster of ExcellenceThe Best of Both WorldsBut what exactly is Broad AI? As opposed to Narrow AI, which is characterized by task specific skills, Broad AI aims at solving a wide array of problems, rather than being limited to a single task or domain. By combining sub-symbolic AI (machine learning, ML) with symbolic AI (knowledge representation and reasoning, KRR), Bilateral AI provides the means to develop the foundations of a new level of AI with broader capabilities for skill acquisition and problem-solving: Broad AI. |

|
KAVis: Visual Interactive Space-Time SegmentationMany application domains generate and analyze multivariate spatial time series and often face data quality issues. Segmentations are very useful for exploratory analysis of these varying data characteristics, but appropriate segmentations are currently challenging or frequently impossible. The project aims to integrate background and domain knowledge within a VA process to provide knowledge-assisted interactive segmentation of such multivariate spatial time series and deal with data quality issues (e.g., missing and uncertain values). |

|
SANE: ViSual ANalytics for Event-based Diffusion on NetworksWe strive to systematically characterize the topic in the visualization research community, developing a common framework to foster research in the area. We will then employ such framework to introduce and refine prototypes to analyze real data about diffusion phenomena, improving current algorithmic solutions, and sharing best practices and lessons learned throughout the project duration. |
| |
Visual Analytics and Computer Vision Meet Cultural HeritageCollections of digitized cultural artifacts offer immense potential to increase the knowledge of our heritage. However, the systematic analysis and presentation of historical photographs and amateur films are still strongly limited. This impedes the analysis, interpretation, and subsequent preservation of human cultural history. |

|
DoRIAH: Domain-adaptive Remote sensing Image Analysis with Human-in-the-loopAnalyzing remote sensing images on a large scale requires to balance two major constraints: accuracy of results and the time it takes to process the images. Using human analysts to accomplish the goal usually provides highly accurate results, but is often not feasible in large-scale scenarios due to the sheer amount of image data to be processed. Consequently, fully automatic image analysis approaches are widely considered but often lack the accuracy needed for the specific problem domain. |
| |
GuidedVA: Guidance-Enriched Visual Analytics for Temporal DataAlthough Visual Analytics provides advanced techniques to tackle complex analysis scenarios, it still challenging for analysts to discern which VA methods to use for particular data and tasks. |
| |
HumanE AI Network |
| |
IMMV: Interactive Music Mapping Vienna: Exploring a City, 1945 up to the present dayThe questions of how music acts in the urban context as a social identification instrument and how music is functionalized to urban symbolic politics form the starting point of the research project conducted by the MUK (Music and Arts University of The City of Vienna). The music component of mental determination of urbanity is created using the example of City of Vienna: How the "sensual" medium of music, generator of atmosphere and mood, produces not only ideological subjects, but also the notion of specific urban spheres? |
 |
KnoVA – Knowledge–Assisted Visual AnalyticsNowadays increasing amounts of data about complex phenomena are collected, stored, and made available for analysis. Visual Analytics (VA), “the science of analytical reasoning facilitated by interactive visual interfaces”, is a multidisciplinary approach to make sense of this data, combining the enormous processing power of computers with the outstanding perceptual and cognitive capabilities of humans. Users of VA systems need to rely on prior knowledge to gain insights from data, formulate and test hypotheses, interpret results, and discover new knowledge. |
| |
VISSECT - Visual Segmentation and Labeling of Multivariate Time SeriesThe overarching objective of this research project is the combination of the three most relevant steps in the process of segmenting and labeling multivariate time series: algorithm selection, parametrization, and uncertainty analysis. Each of these steps is a research problem on its own, and we will contribute novel solutions to all of them. However, only the combination of the different aspects will comprehensively address the important challenge of visual analytics as identified by Jarke van Wijk: "Which model? Which parametrization? |

|
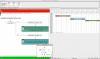
A-PlanUser and task analysisTo illustrate the problem, all tasks and the currently used software were investigated. We found many usability problems in the existing software system (SAP CRM). The process of an incoming call is illustrated here: |
|
AsbruFlow - Interactive Information Visualization to Support Protocol-based CareBased on the Software Prototype CareVis, this project is an approach to communicate the complex logic of Asbruplans to domain experts like physicians or nursing staff. |

|
Blind Source Separation in Time and SpaceThere is nowadays an abundance of measurements which are taken at specific locations and / or repeatedly over time. For the resulting multivariate spatial, temporal and spatio-temporal data it can often be assumed that there is a lot of noise in the data and only a few latent signal components carry all the relevant information. |
| |
Brigid |
|
CareVis - Interactive Visualization Methods to Support Protocol-Based CareWe provide multiple simultaneous views to cover different aspects of a complex underlying data structure of treatment plans and patient data. The tightly coupled views use visualization methods well-known to domain experts and are designed to facilitate users' tasks. CareVis enables a meaningful navigation, provides annotations on demand for not overwhelming the viewer, and helps to keep orientation by using focus+context techniques, thus increasing the flexibility in working with treatment plans and patient data. |
| |
CPGPro – Extracting Process Information from Clinical Practice GuidelinesLike in many other domains, computerization is seen as a means to facilitate the effective use of Clinical Practice Gudelines (CPGs). Therefore, transforming CPGs in a machine-readable and executable format has been the gist of research. Consequently, many guideline representation languages are developed and modelling tools are designed which convert CPGs in their corresponding models defined in these guideline representation languages. Available modelling tools are restricted in the way that they only allow a manual computerization process. |

|
CVAST - Centre for Visual Analytics Science and TechnologyCVAST aims to design and develop innovative methods for data interpretation to capture the daily flood of information in interactive visualizations and analyses. Scenarios that involve temporal properties of such data are in the focus of our scientific interest. |
| |
DAD - Digital Aided Guide for Fathers-to-beThe aim of this project is the implementation of the “Digital Aided Guide for Fathers-to-be” in several participating partner countries. This guide has been well established in Austria since 2004 and has evolved from a project at the Danube University Krems (Austria). In order to achieve a successful market launch, the project’s partners from Poland, the Czech Republic, Romania and the Netherlands will adopt the Austrian service according to their national cultural, social and legal circumstances. |
| |
DeTable – A Wrapper for Complex HTML TablesThe main purpose of this student project is a wrapper that transforms complex HTML tables into an XML format. The complexity of the HTML tables is defined by the occurrence of spanned cells. |
| |
DeVisOR - Detection and Visualization of unexploded Ordnance RisksAnalysis of historic air photos (images) with the goal of detecting unexploded bombs is a niche task, yet extremely important for preventing great damage or even loss of life. The computer science techniques and software tools currently available are of general nature, like Geographic Information Systems (GIS) and graphics editing programs. |
| |
DisCō - Visual DIScovery and COmmunication of complex time patterns in non regularly gathered multigranular and multivariate dataThe capabilities to generate and collect data and information have seen an explosive growth and overwhelm traditional methods of data analysis such as spreadsheets, ad-hoc queries, or simple visualizations. Exploring trends, patterns, and relationships are particularly important when dealing with large amounts of data. The human perceptual system is highly sophisticated and specifically suited to spot visual patterns. |

|
Doctoral College: Environmental Informatics
|

|
Dynamic XML Query Table Editor (DQT)DQT supports the creation of such databases as well as their presentation and includes the following features: |
| |
EvalBench: A Software Library for Visualization EvaluationTo pave the way for future experimenters in the HCI field, the Java software library EvalBench was developed that focused on flexibility and reusability and should be easy to integrate into existing Java visualization applications. |
