Projects

|
Social RewardingWikipedia - the most famous free encyclopedia - has been grown to the biggest wiki community site where hundreds of thousands of users all around the world post and edit articles in many different languages. As other online communities have troubles motivating users to participate actively, the tremendous contribution rate on Wikipedia has led to many problems like wrong information, copyright violations, or users' misbehavior, for example, spammers or trolls. |
| |
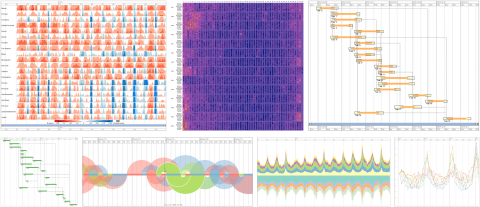
TimeBench: A Data Model and Software Library for Visual Analytics of Time-Oriented DataTimeBench is a free and open source software library that provides foundational data structures and algorithms for time-oriented data in Visual Analytics. Its expressiveness and developer accessibility have been evaluated through application examples demonstrating a variety of challenges with time-oriented data and long-term developer studies conducted in the scope of research and student projects.
|
|
TimeRider – Visualizing Patient Cohorts by Animated Scatter PlotsThe aim of this project was to develop a program, which helps to show the development of medical parameters over time. These (30) parameters result from examinations of patients who are treated for diabetes. The examinations take place in irregular intervals from six weeks up to three months. |

|
TimeViewer/TimeVis - Visualizing Temporal Data using prefuse
Particularly the requirements were: |

|
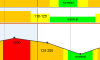
TrainVis - Interactive visualization of train schedulesTimetables for trains or airplanes are often represented astextual tables. These contain usually all important information, however it is often not easy to find answersto more specific questions, like for example - "which train should I taketo travel from Vienna to Paris as quick as possible without changing the train twice?" - Humans can process visual information better than text and that?s why our application shall facilitate the process of understanding and searching a timetable. |

|
TrainVis 2 - Interactive visualization of railway timetablesTrainVis facilitates the visualization of railway timetables using several different types of representations. |

|
Urumqi Project - The Water Quality MeasurementThe water supply company of an city in north-west China has commissioned KSC to build a remotely controlled system for monitoring of the water quality. The water quality is measured by measuring probes supplied by the company s::can. The main tasks of the system are retrieving, storing, visualization and delivery of data from s::can measuring probes. The following individual components are used: 1. SCADA system |
| |
ViENA: Visual Enterprise Network AnalyticsThe research project VIENA (Visual Enterprise Network Analytics) aims to develop and test a prototype software of visual network analysis that will be capable to support organizational consulting services. As its focus will be the visualization of change, its main purpose is the display and evaluation of change management processes. |
| |
VisMaster CA -- Visual Analytics - Mastering the Information AgeVisMaster is a European Coordination Action Project focused on the research discipline of Visual Analytics: One of the most important challenges of the emerging Information Age is to effectively utilise the immense wealth of information and data acquired, computed and stored by modern information systems. On the one hand, the appropriate use of available information volumes offers large potential to realize technological progress and business success. |
|
Visualization Technique for Time-Oriented Data with Semantic ZoomThis project is part of the research project VisuExplore, which is dealing with the interactive visualization of patient data to assist physicians and medical staff. Prototype: The visualization techniques have been developed in the Midgaard project but so far only been implemented in Flash to demonstrate the idea of the concept. |
| |
VisuExplore – Gaining New Medical Insights from Visual ExplorationThe application of modern technology in clinical practice leads to a massive increase in quantity and complexity of electronically acquired medical data and information. Current commercial clinical information systems are faced with the explosion of available medical data and users of these systems ask for alternative, more intuitive solutions. |