Visualization Technique for Time-Oriented Data with Semantic Zoom
- Stephan Hoffmann
- Wolfgang Aigner
- Alexander Rind
- Silvia Miksch
- Thomas Turic
This project is part of the research project VisuExplore, which is dealing with the interactive visualization of patient data to assist physicians and medical staff.
Prototype:
The visualization techniques have been developed in the Midgaard project but so far only been implemented in Flash to demonstrate the idea of the concept.
The idea is to use the available display space efficiently by using a semantic zoom technique, i.e. adapting the visual representation of the data according to the available display space. In the medical domain it is quite common to interpret measured vital parameters and assign measured values to specific categories (qualitative abstractions). For example, in the case of hyperglycemia, blood glucose measurements are usually categorized using a threshold: a blood glucose measurement above 125.0 mg/dl can be assigned to the elevated blood glucose level and blood glucose measurement below 125.0 mg/dl to the normal blood glucose level. To apply the idea of semantic zooming to time-oriented quantitative data, qualitative abstractions can be used to create different visual information resolutions (VIRs) for the visualized data at different zoom levels and also present the user interpreted a-priori knowledge, if available for the data.
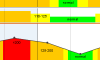
The lowest visual information resolution level only presents the qualitative abstractions (categories) of the underlying quantitative values as colored horizontal bars over a period of time. The colors are used to represent periods of different qualitative categories. As an example, periods of critical blood glucose levels can be colored red, elevated levels orange and normal levels green.
The visual representation for the next zoom level is a descendant of the color-coded horizontal bars and enhances the representation by using different heights for the bars. This visual encoding makes it possible to intuitively show the ordinal scale of the qualitative levels.
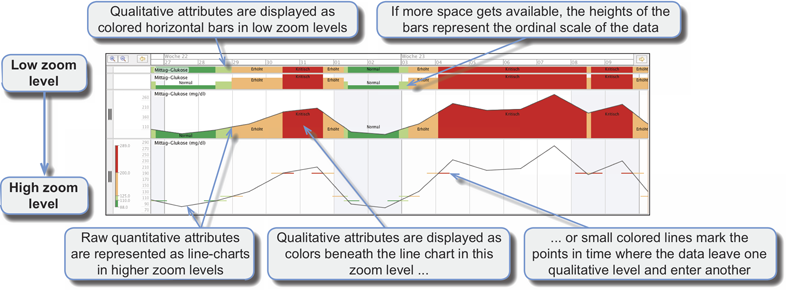
The next step in the visual information resolution hierarchy combines the intuitive qualitative representations with a more detailed quantitative representation, called hybrid techniques. The first hybrid representation enhances a line-chart with color-coded qualitative regions below the curve.
The second hybrid technique uses the same color-coding as in the previous representations, but this time the y-axis is colored to visualize the qualitative categories. Additionally, small colored lines mark the points in time where the values leave one qualitative level and enter another.
These visualizations reach their limits when it comes to display high frequency data, because many data values have to be laid down on one display region. In this project, we use a visualization similar to box plots (maximum, minimum, 75% percentile, 25% percentile and median) to temporally aggregate the data:

The project was developed under Eclipse 3.4.0 with JDK 1.6, prefuse beta (release 2007.10.20) toolkit and the TimeVis API developed by Peter Weishapl.
Evaluation:
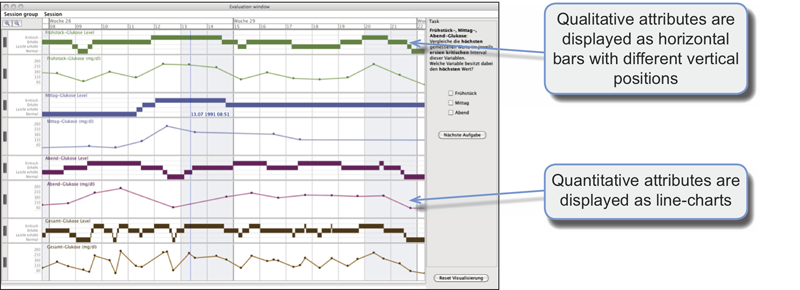
This visualization technique appears very promising but novel visualization techniques need to present measurable benefits to encourage more widespread adoption. To assess the effectiveness of this visualization technique, an empirical comparative study was performed. The visualization technique that was used for the comparison is also capable of displaying raw quantitative values and qualitative abstractions but uses static and separate visual representations for quantitative and qualitative attributes of the data. The comparison technique is based on the visualization that is used in the KNAVE project.
Comparison visualization prototype used in the empirical evaluation:
The test persons had to complete 12 different tasks, which were split into two blocks with both visualization techniques:
- Lookup and comparison tasks addressing the qualitative attributes of the data.
- Lookup and comparison tasks addressing quantitative attributes of the data within specified qualitative levels.
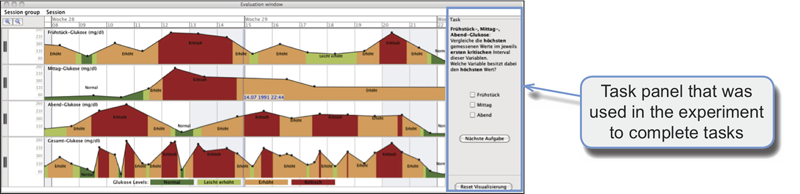
SemTimeZoom visualization prototype used in the empirical evaluation:
The test persons were generally faster completing the tasks using the integrated SemTimeZoom visualization compared to the separate and static visualization. Particularly for more complex tasks the difference of the completion times was found to be statistically significant:
No significant differences of the error rates were found between both visualization techniques. Additionally, the user preference was significantly higher in favor of SemTimeZoom.
Papers:
Aigner, W.; Rind, A. & Hoffmann, S.: Comparative Evaluation of an Interactive Time-Series Visualization that Combines Quantitative Data with Qualitative Abstractions, Computer Graphics Forum, Special Issue "EuroVis 2012", Vol. 31, No. 3, p. 995-1004, 2012. doi:10.1111/j.1467-8659.2012.03092.x
Hoffmann, S.: Empirical evaluation of a visualization technique with semantic zoom, Master Thesis, Vienna University of Technology, 2011.
Related Work:
- Bade, Ragnar; Schlechtweg, Stefan; Miksch, Silvia: Connecting Time-Oriented Data and Information to a Coherent Interactive Visualization, in Proceedings of the ACM Conference on Human Factors in Computing Systems (CHI-2004), ACM Press, pp. 105-112, 2004.
- Bade, Ragnar: Methoden zur Visualisierung von und Interaktion in zeitbasierten Patientendaten und Behandlungsplänen, Master thesis, Department of Simulation and Graphics, Faculty of Computer Science, University of Magdeburg, Germany, 2002.
- VisuExplore – Gaining New Medical Insights from Visual Exploration
- KNAVE – Knowledge-based Navigation of Abstractions for Visualization and Explanation
- MIDGAARD – Connecting Time-Oriented Data and Information to a Coherent Interactive Visualization
- TimeViewer – Visualizing Temporal Data using prefuse