|
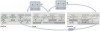
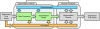
Andreas Walch, Michael Schwärzler, Christian Luksch, Elmar Eisemann, Theresia Gschwandtner, "LightGuider: Guiding Interactive Lighting Design using Suggestions, Provenance, and Quality Visualization",
IEEE Transactions on Visualization and Computer Graphics (TVCG), vol. 26, pp. 10, 2020.
paper |
|
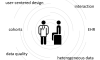
Christian Bors, "Facilitating Data Quality Assessment Utilizing Visual Analytics: Tackling Time, Metrics, Uncertainty, and Provenance",
Institute of Visual Computing and Human-Centered Technology, vol. PhD, Dr.-techn., 2020.
|
|
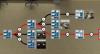
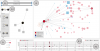
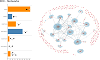
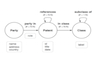
Roger Leite, Theresia Gschwandtner, Silvia Miksch, Erich Gstrein, Johannes Kuntner, "NEVA: Visual Analytics to Identify Fraudulent Networks",
Computer Graphics Forum, vol. 39, 2020.
paper https://onlinelibrary.wiley.com/doi/pdf/10.1111/cgf.14042 |

|
Davide Ceneda, "Guidance-Enriched Visual Analytics",
Institute of Visual Computing and Human-Centered Technology, vol. PhD, Dr.-techn., pp. 206, 2020.
|
|
Markus Bögl, "Visual Analysis of Periodic Time Series Data - Supporting Model Selection, Prediction, Imputation, and Outlier Detection Using Visual Analytics",
Institute of Visual Computing and Human-Centered Technology, vol. PhD, Dr.-techn., 2020.
|
| |
Andreas Scheidl, "Exploring networks over time and space utilizing visual analytics",
Institute of Visual Computing and Human-Centered Technology, pp. 112, 2020.
|
| |
Matthias Reisacher, "Interactive web-based visualization of large dynamic graphs",
Institute of Visual Computing and Human-Centered Technology, pp. 94, 2020.
|

|
Velitchko Filipov, Alessio Arleo, Paolo Federico, Silvia Miksch, "CV3: Visual Exploration, Assessment, and Comparison of CVs",
Computer Graphics Forum, vol. 38, pp. 11, 2019.
|
|
Christian Bors, John Wenskovitch, Michelle Dowling, Simon Attfield, Leilani Battle, Alex Endert, Olga Kulyk, Robert Laramee, "A Provenance Task Abstraction Framework",
IEEE Computer Graphics and Applications, vol. 39, pp. 15, 2019.
|
| |
Till Weißer, "A highly expressive, visually supported graph traversal environment",
Institute of Visual Computing and Human-Centered Technology, pp. 88, 2019.
|
|
Jürgen Bernard, Christian Bors, Markus Bögl, Christian Eichner, Theresia Gschwandtner, Silvia Miksch, Heidrun Schumann, Jörn Kohlhammer, "Combining the Automated Segmentation and Visual Analysis of Multivariate Time Series",
EuroVis Workshop on Visual Analytics (EuroVA) 2018, pp. 49–53, 2018.
|

|
Christian Bors, Theresia Gschwandtner, Silvia Miksch, "Visually Exploring Data Provenance and Quality of Open Data",
EuroVis 2018 - Posters, pp. 9–11, 2018.
|

|
Davide Ceneda, Theresia Gschwandtner, Thorsten May, Silvia Miksch, Marc Streit, Christian Tominski, "Guidance or No Guidance? A Decision Tree Can Help",
EuroVA: International Workshop on Visual Analytics, pp. 19–23, 2018.
|
|
Roger Leite, Theresia Gschwandtner, Silvia Miksch, Erich Gstrein, Johannes Kuntner, "Network Analysis for Financial Fraud Detection",
EuroVis 2018 - Posters, 2018.
|

|
Natalia Andrienko, Tim Lammarsch, Gennady Andrienko, Georg Fuchs, Daniel Keim, Silvia Miksch, Alexander Rind, "Viewing Visual Analytics as Model Building",
Computer Graphics Forum, vol. 37, pp. 275–299, 2018.
|

|
Theresia Gschwandtner, Oliver Erhart, "Know Your Enemy: Identifying Quality Problems of Time Series Data",
IEEE Pacific Visualization Symposium (PacificVis '18), pp. 205-214, 2018.
|
| |
Fabian Filip, "Interactive Visualization of Medication Histories",
Institute of Visual Computing and Human-Centered Technology, pp. 111, 2018.
|
| |
Anca Cismasiu, "Sports acitivity suggestions : a visual analytics approach",
Institute of Visual Computing and Human-Centered Technology, pp. 73, 2018.
|
|
Alexander Rind, Paolo Federico, Theresia Gschwandtner, Wolfgang Aigner, Jakob Doppler, Markus Wagner, "Visual Analytics of Electronic Health Records with a Focus on Time",
New Perspectives in Medical Records: Meeting the Needs of Patients and Practitioners, pp. 65-77, 2017.
|
|
Davide Ceneda, Theresia Gschwandtner, Thorsten May, Silvia Miksch, Hans-Jörg Schulz, Marc Streit, Christian Tominski, "Characterizing Guidance in Visual Analytics",
IEEE Transactions on Visualization and Computer Graphics, vol. 23, pp. 111-120, 2017.
|
| |
Robert Thurnher, "TempMunger: A Visual Analytics Approach Supporting Transformations of Time-Oriented Data",
Institute of Visual Computing and Human-Centered Technology, pp. 97, 2017.
|
| |
Sanja Bonic, "CV 2.0 - Global Resume",
Institute of Visual Computing and Human-Centered Technology, pp. 90, 2017.
|
| |
Velitchko Filipov, "Visual exploration and comparison of multiple resume : focus on time and space",
Institute of Visual Computing and Human-Centered Technology, pp. 75, 2017.
|

|
Markus Wagner, Fabian Fischer, Robert Luh, Andrea Haberson, Alexander Rind, Daniel Keim, Wolfgang Aigner, "A Survey of Visualization Systems for Malware Analysis",
Eurographics Conference on Visualization (EuroVis) State of The Art Reports, pp. 105–125, 2015.
Supplementary Material |
|
Florian Windhager, Albert Amor-Amorós, Michael Smuc, Paolo Federico, Lukas Zenk, Silvia Miksch, "A concept for the exploratory visualization of patent network dynamics",
Proceedings of the 6th International Conference on Information Visualization Theory and Applications, 2015.
|