|
Natkamon Tovanich, Raphael Arthur Buchmüller, Velitchko Filipov, Fatih Öztank, Ignacio Baltazar Pérez Messina, Sandhya Rajendran, Wolfgang Aigner, Silvia Miksch, "Visual Analytics",
Wintergraph 2026, 2026.
|

|
Velitchko Filipov, "Networks In Motion : networks, diffusion, influence tracing, and what-if?",
Introduction at giCenter, 2026.
|
| |
Damir Dizdarevic, "Comparative Evaluation of Business Analytics and Visualization Tools and Applications",
Institute of Visual Computing and Human-Centered Technology, pp. 109, 2026.
|

|
Lisa Teichmann, Velitchko Filipov, "Between center and periphery: networks of translated German fiction authors in the German National Library",
Digital Scholarship in the Humanities, pp. article no. fqag041, 2026.
|
|
S. Di Bartolomeo, A. Dobler, Velitchko Filipov, M. Nöllenburg, Henry Ehlers, "The Story(line) So Far: A Survey on Storyline Visualization",
28th Eurographics Conference on Visualization (EuroVis 2026), vol. 45/3, pp. 30, 2026.
|

|
Velitchko Filipov, Tobias Isenberg, Alexander Lex, "README.md: A Tutorial on Reproducible Visualization Research",
28th Eurographics Conference on Visualization (EuroVis 2026), pp. 4, 2026.
|
|
Tom Baumgartl, M. Sondag, Velitchko Filipov, Michaela Tuscher, Sandhya Rajendran, Silvia Miksch, D. Archambault, Alessio Arleo, T. von Landesberger, "Survey on Visualization of Information Diffusion over Networks",
28th Eurographics Conference on Visualization (EuroVis 2026), vol. 45/3, pp. 42, 2026.
|

|
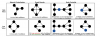
Sandhya Rajendran, Michaela Tuscher, Alessio Arleo, D. Archambault, Silvia Miksch, T. von Landesberger, Velitchko Filipov, "Happy Puzzles: Puzzle Games for Visualization Task Abstraction",
EuroVis 2026 - 28th EG Conference on Visualization, pp. 6, 2026.
|

|
Michaela Tuscher, Markus Bögl, "Visual Analytics",
Wintergraph 2025, 2025.
|

|
Tom Baumgartl, Mohammad Ghoniem, Tatiana von Landesberger, G Elisabeta Marai, Silvia Miksch, Sibylle Mohr, Simone Scheithauer, Nikita Srivastava, "Empowering Communities: Tailored Pandemic Data Visualization for Varied Tasks and Users",
IEEE Computer Graphics and Applications, vol. 45, pp. 130-138, 2025.
|

|
, "VisGames 2025: EuroVis Workshop on Visualization Play, Games, and Activities",
, 2025.
|

|
Ignacio Baltazar Pérez Messina, Marco Angelini, Davide Ceneda, Christian Tominski, Silvia Miksch, "Coupling Guidance and Progressiveness in Visual Analytics",
EuroVis 2025, 2025.
|

|
Wolfgang Aigner, Silvia Miksch, Franziska Proksa, Robert Sablatnig, Markus Seidl, Waldner, Manuela, Matthias Zeppelzauer, "Visual Heritage: Visual Analytics and Computer Vision Meet Cultural Heritage (doc.funds.connect)",
18. Forschungsforum Der Österreichischen Fachhochschulen, pp. 558-559, 2025.
|
|
Markus Passecker, Silvia Miksch, Franziska Proksa, Wolfgang Aigner, "The past is all around you: Augmenting cultural heritage on-site",
27th EG Conference on Visualization (EuroVis 2025 ), pp. 3, 2025.
|

|
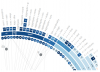
Velitchko Filipov, Davide Ceneda, Daniel Archambault, Alessio Arleo, "TimeLighting: Guided Exploration of 2D Temporal Network Projections",
IEEE Transactions on Visualization and Computer Graphics, pp. 13, 2025.
|
| |
Maath Musleh, Renata Georgia Raidou, Davide Ceneda, "TrustME: A Context-Aware Explainability Model to Promote User Trust in Guidance",
IEEE Transactions on Visualization and Computer Graphics, pp. 17, 2025.
|
| |
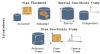
Mert Eyüp Usul, "THOVEA: A Three-Layer Visual Analytics System for Information Diffusion over Large Networks",
Institute of Visual Computing and Human-Centered Technology, pp. 86, 2025.
|

|
Sanne van der Linden, Velitchko Filipov, Luise Pufahl, Silvia Miksch, Stef van den Elzen, "Towards Integrating Visual Analytics in Multi-Perspective Conformance Checking: A Call to Action",
27th EG Conference on Visualization (EuroVis 2025 ), pp. 6, 2025.
|
|
Markus Passecker, Victor A. de Jesus Oliveira, Paolo Buono, Silvia Miksch, Wolfgang Aigner, "Reconnecting Artifacts and Place: A Review of Situated Visualization in Cultural Heritage",
9th Workshop on Visualization for the Digital Humanities (VIS4DH 2025), pp. 7-13, 2025.
|

|
Andrea Burattin, Silvia Miksch, Shazia Sadiq, Hans-Jörg Schulz, Katerina Vrotsou, "VESPA: Visual Event-Stream Progressive Analytics",
Business Process Management 2025 International Workshops, pp. 8, 2025.
|
|
Johanna Schmidt, Bernhard Pointner, Silvia Miksch, "Visual Analytics for Understanding Draco's Knowledge Base",
IEEE Transactions on Visualization and Computer Graphics, vol. 30, pp. 392-402, 2024.
|
| |
Velitchko Filipov, "Visual Analytics",
Wintergraph 2024, 2024.
|
|
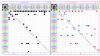
Nikolaus-Mathias Herl, Velitchko Filipov, "AdMaTilE: Visualizing Event-Based Adjacency Matrices in a Multiple-Coordinated-Views System",
32nd International Symposium on Graph Drawing and Network Visualization (GD 2024), vol. 320, pp. 46:1-46:3, 2024.
|
|
Maath Musleh, Davide Ceneda, Henry Ehlers, Renata Georgia Raidou, "ConAn: Measuring and Evaluating User Confidence in Visual Data Analysis Under Uncertainty",
Computer Graphics Forum, pp. 18, 2024.
|
|
Davide Ceneda, Christopher Collins, Mennatallah El-Assady, Silvia Miksch, Christian Tominski, Alessio Arleo, "A heuristic approach for dual expert/end-user evaluation of guidance in visual analytics",
IEEE Transactions on Visualization and Computer Graphics, vol. 30, pp. 997-1007, 2024.
|