
|
Velitchko Filipov, "Networks In Motion : networks, diffusion, influence tracing, and what-if?",
Introduction at giCenter, 2026.
|
|
S. Di Bartolomeo, A. Dobler, Velitchko Filipov, M. Nöllenburg, Henry Ehlers, "The Story(line) So Far: A Survey on Storyline Visualization",
28th Eurographics Conference on Visualization (EuroVis 2026), vol. 45/3, pp. 30, 2026.
|
|
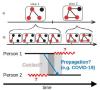
Tom Baumgartl, M. Sondag, Velitchko Filipov, Michaela Tuscher, Sandhya Rajendran, Silvia Miksch, D. Archambault, Alessio Arleo, T. von Landesberger, "Survey on Visualization of Information Diffusion over Networks",
28th Eurographics Conference on Visualization (EuroVis 2026), vol. 45/3, pp. 42, 2026.
|

|
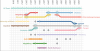
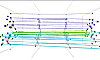
Velitchko Filipov, Davide Ceneda, Daniel Archambault, Alessio Arleo, "TimeLighting: Guided Exploration of 2D Temporal Network Projections",
IEEE Transactions on Visualization and Computer Graphics, pp. 13, 2025.
|
| |
Mert Eyüp Usul, "THOVEA: A Three-Layer Visual Analytics System for Information Diffusion over Large Networks",
Institute of Visual Computing and Human-Centered Technology, pp. 86, 2025.
|

|
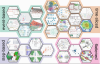
Daniel Pahr, Henry Ehlers, Velitchko Filipov, "HoloGraphs: An Interactive Physicalization for Dynamic Graphs",
20th International Joint Conference on Computer Vision, Imaging and Computer Graphics Theory and Applications (VISIGRAPP , GRAPP, HUCAPP and IVAPP 2025), vol. 1, pp. 859-866, 2025.
|
|
Tom Baumgartl, Velitchko Filipov, Sandhya Rajendran, Silvia Miksch, Daniel Archambault, Alessio Arleo, Tatiana von Landesberger, "Layers of Doubt: Typology of Temporal Uncertainty in Dynamic Diffusion Networks",
[IEEEVIS 2025 Workshop] Uncertainty Visualization: Unraveling Relationships of Uncertainty, AI, and Decision-Making, 2025.
|
| |
Velitchko Filipov, ""Networks in Time and Space, Visual Analytics of Dynamic Network Representations"",
Institute of Visual Computing and Human-Centered Technology, pp. 197, 2024.
|
|
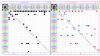
Nikolaus-Mathias Herl, Velitchko Filipov, "AdMaTilE: Visualizing Event-Based Adjacency Matrices in a Multiple-Coordinated-Views System",
32nd International Symposium on Graph Drawing and Network Visualization (GD 2024), vol. 320, pp. 46:1-46:3, 2024.
|
| |
Luca Rauchenberger, "Dynamic Network Analysis with Centrality Measures",
Institute of Visual Computing and Human-Centered Technology, pp. 104, 2024.
|
|
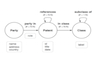
Florian Windhager, Albert Amor-Amorós, Michael Smuc, Paolo Federico, Lukas Zenk, Silvia Miksch, "A concept for the exploratory visualization of patent network dynamics",
Proceedings of the 6th International Conference on Information Visualization Theory and Applications, 2015.
|
|
Paolo Federico, Wolfgang Aigner, Silvia Miksch, Florian Windhager, Lukas Zenk, "A Visual Analytics Approach to Dynamic Social Networks",
Proceedings of the 11th International Conference on Knowledge Management and Knowledge Technologies (i-KNOW), Special Track on Theory and Applications of Visual Analytics (TAVA), pp. 47:1–47:8, 2011.
|