|
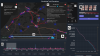
Sandhya Rajendran, Alessio Arleo, Tatiana von Landesberger, Silvia Miksch, max sondag, Michaela Tuscher, Velitchko Filipov, "Don't Stop Me Now: Visualizing Disruptions in Railroad Networks",
IEEE VIS 2025, 2025.
|
|
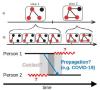
Tom Baumgartl, Velitchko Filipov, Sandhya Rajendran, Silvia Miksch, Daniel Archambault, Alessio Arleo, Tatiana von Landesberger, "Layers of Doubt: Typology of Temporal Uncertainty in Dynamic Diffusion Networks",
[IEEEVIS 2025 Workshop] Uncertainty Visualization: Unraveling Relationships of Uncertainty, AI, and Decision-Making, 2025.
|
| |
Velitchko Filipov, ""Networks in Time and Space, Visual Analytics of Dynamic Network Representations"",
Institute of Visual Computing and Human-Centered Technology, pp. 197, 2024.
|
| |
Adam Nedas, "Utilizing visual analytics for network exploration in the domain of art history research",
Institute of Visual Computing and Human-Centered Technology, pp. 123, 2023.
|
| |
Andreas Scheidl, "Exploring networks over time and space utilizing visual analytics",
Institute of Visual Computing and Human-Centered Technology, pp. 112, 2020.
|
| |
Matthias Reisacher, "Interactive web-based visualization of large dynamic graphs",
Institute of Visual Computing and Human-Centered Technology, pp. 94, 2020.
|