CVAST - Centre for Visual Analytics Science and Technology

Aim

CVAST aims to design and  develop innovative methods for data interpretation to capture the daily flood of information in interactive visualizations and analyses. Scenarios that involve temporal properties of such data are in the focus of our scientific interest.


alternative webpage @ w-fFORTE

Publications


Duration
-
Funding

This project is funded by the Austrian Federal Ministry of Science, Research, and Economy (formerly known as Austrian Federal Ministry of Economy, Family and Youth) in the exceptional Laura Bassi Centres of Excellence initiative, project number: 822746 (Phase 1) /840262 (Phase 2).

Centres of Expertise - Laura Bassi

Contact
Status
finished

CVAST aims to design and  develop innovative methods for data interpretation to capture the daily flood of information in interactive visualizations and analyses. Scenarios that involve temporal properties of such data are in the focus of our scientific interest.

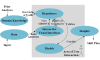
Due to the proliferating capabilities to generate and collect vast amounts of data and information we face the challenge that users and analysts get lost in irrelevant, or otherwise inappropriately processed or presented information. This phenomenon, commonly known as information deluge, overwhelms traditional methods of data analysis such as spreadsheets, ad-hoc queries, or simple visualizations. At the same time, intelligent usage of increasingly available data offers great opportunities to promote technological progress and business success. On this score, Visual Analytics is an emerging research discipline developing methods and technology that make the best possible use of huge information loads in a wide variety of applications. The basic idea is to appropriately combine the strengths of both, computers' and humans' information processing capabilities. To make complex information structures more comprehensible, facilitate new insights, and enable knowledge discovery, methods of visualization, intelligent data analysis, and mining form a symbiosis with the human user via interactive visual interfaces.

The goals of the Centre of Visual Analytics Science and Technology (CVAST) are twofold. The first goal is the integration of the outstanding capabilities of humans in terms of visual information exploration with the enormous processing power of computers to form a powerful knowledge discovery environment. The second goal is to scientifically assess the usability and utility of such discovery environments while bridging the gap between theory and practice for selected application scenarios.

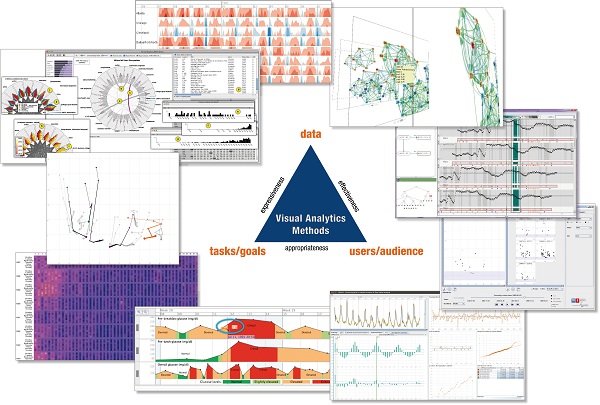
Application scenarios that involve temporal properties are in the focus of our scientific interest. Time - in contrast to other quantitative data dimensions that are usually "flat" - has an inherent structure and distinct characteristics (calendar aspect, natural and social aspects, etc.) which increase its complexity dramatically and demand specialized Visual Analytics methods in order to support proper analysis and visualization. Our expected results will be Innovative, user-oriented, and task-specific Visual Analytics methods and tools with an assessment of their usability and utility. These methods will be used intertwinedly and iteratively to ease the explorative information discovery processes

An appropriate framework for these methods and tools. Their evaluation in 'real life' environments and examination of the information discovery process within several application scenarios. A new methodology to define and evaluate insights facilitated by these methods. Applying these methods within commercial applications to illustrate their business value and economic impacts

Publications

Paolo Federico, Wolfgang Aigner, Silvia Miksch, Jürgen Pfeffer, Michael Smuc, Florian Windhager, Lukas Zenk, "ViENA: Visual Enterprise Network Analytics", Poster Proceedings of the 3rd International Workshop on Visual Analytics (EuroVA), pp. 12, 2012. paper
Paolo Federico, Jürgen Pfeffer, Wolfgang Aigner, Silvia Miksch, Lukas Zenk, "Visual Analysis of Dynamic Networks using Change Centrality", Proceedings of the International Conference on Advances in Social Networks Analysis and Mining (ASONAM), pp. 179 - 183, 2012. paper
Florian Windhager, Michael Smuc, Lukas Zenk, Paolo Federico, Jürgen Pfeffer, Wolfgang Aigner, Silvia Miksch, "Visual Knowledge Networks Analytics", Knowledge Management Handbook, pp. 187–206, 2012. paper
Alan MacEachren, Silvia Miksch, "Guest Editors' Introduction: Special Section on the IEEE Conference on Visual Analytics Science and Technology (VAST)", IEEE Transactions on Visualization and Computer Graphics, vol. 18, pp. 660–661, 2012. paper
Brian Fisher, Silvia Miksch, "Guest Editors' Introduction to the Vast 2010 Special Issue-Special Issue of best papers of Visual Aanlytics Science and Technology (VAST) 2010", Information Visualization, vol. 11, pp. 188–189, 2012. paper
Andreas Seyfang, Katharina Kaiser, Theresia Gschwandtner, Silvia Miksch, "Visualizing Complex Process Hierarchies During the Modeling Process", First International Workshop on Theory and Applications of Process Visualization (TAProViz'12), 2012. paper
Tim Lammarsch, Alexander Rind, Wolfgang Aigner, Silvia Miksch, "Developing an Extended Task Framework for Exploratory Data Analysis Along the Structure of Time", Proceedings of the EuroVis Workshop on Visual Analytics in Vienna, Austria (EuroVA 2012), pp. 31-35, 2012. paper
Wolfgang Aigner, Alexander Rind, Stephan Hoffmann, "Comparative Evaluation of an Interactive Time-Series Visualization that Combines Quantitative Data with Qualitative Abstractions", Computer Graphics Forum, vol. 31, pp. 995-1004, 2012. paper
Bilal Alsallakh, Wolfgang Aigner, Silvia Miksch, Eduard Gröller, "Reinventing the Contingency Wheel: Scalable Visual Analytics of Large Categorical Data", IEEE Transactions on Visualization and Computer Graphics (Proceedings of IEEE VAST 2012), vol. 18, pp. 2849-2858, 2012. paper Visual and interaction metaphors of Contingency Wheel++ (5 min)
Theresia Gschwandtner, Johannes Gärtner, Wolfgang Aigner, Silvia Miksch, "A Taxonomy of Dirty Time-Oriented Data", Lecture Notes in Computer Science (LNCS 7465): Multidisciplinary Research and Practice for Information Systems (Proceedings of the CD-ARES 2012), pp. 58 -- 72, 2012. paper
Simone Kriglstein, Margit Pohl, Claus Stachl, "Animation for Time-oriented Data: An Overview of Empirical Research", 16th International Conference on Information Visualisation (IV), pp. 30 -35, 2012. paper
Margit Pohl, Michael Smuc, Eva Mayr, "The User Puzzle: Explaining the Interaction with Visual Analytics Systems", Visualization and Computer Graphics, IEEE Transactions on, vol. 18, pp. 2908 -2916, 2012. paper
Margit Pohl, "Methodologies for the Analysis of Usage Patterns in Information Visualization", Proceedings of the BELIV 2012 workshop, 2012. paper
Theresia Gschwandtner, "Interactive Visualization of Effects of Medical Treatment on a Patient’s Condition", Institute of Software Technology & Interactive Systems, pp. 140, 2012. paper
Bilal Alsallakh, "Visual Analytics of Large Multivariate Matrix Data", Poster: IEEE VisWeek Doctoral Colloquium, 2012. paper Fast Forward @ VisWeek 2012
Simone Kriglstein, Florian Scholz, Margit Pohl, Bilal Alsallakh, Silvia Miksch, "Evaluating the Dot-Based Contingency Wheel: Results from an Interview Study", Technical Report, pp. 10, 2012.
Theresia Gschwandtner, Wolfgang Aigner, Katharina Kaiser, Silvia Miksch, Andreas Seyfang, "CareCruiser: Exploring and Visualizing Plans, Events, and Effects Interactively", 4th IEEE Pacific Visualization Symposium, pp. 43--50, 2011.
Wolfgang Aigner, Silvia Miksch, Heidrun Schumann, Christian Tominski, "Visualization of Time-Oriented Data", Human-Computer Interaction, pp. 286, 2011. paper
Theresia Gschwandtner, Wolfgang Aigner, Katharina Kaiser, Silvia Miksch, Andreas Seyfang, "Design and Evaluation of an Interactive Visualization of Therapy Plans and Patient Data", Proceedings of the 25th BCS Conference on Human Computer Interaction Conference (HCI2011), pp. 421-428, 2011.
Wolfgang Aigner, "Understanding the Role and Value of Interaction: First Steps", Proc. of the International Workshop on Visual Analytics (EuroVA 2011), pp. 17--20, 2011.
Bilal Alsallakh, Eduard Gröller, Silvia Miksch, Martin Suntinger, "Contingency Wheel: Visual Analysis of Large Contingency Tables", Proceedings of the International Workshop on Visual Analytics (EuroVA), pp. 53-56, 2011. paper Visual Metaphor
Tim Lammarsch, Wolfgang Aigner, Alessio Bertone, Silvia Miksch, Alexander Rind, "Towards a Concept how the Structure of Time Can Support the Visual Analytics Process", Proceedings of the Second International Workshop on Visual Analytics held in Europe (EuroVA 2011), pp. 9--12, 2011. paper
Wolfgang Aigner, Christian Kainz, Rui Ma, Silvia Miksch, "Bertin was Right: An Empirical Evaluation of Indexing to Compare Multivariate Time-Series Data Using Line Plots", Computer Graphics Forum, vol. 30, pp. 215--228, 2011. paper
Thomas Schneider, Wolfgang Aigner, "A-Plan: Integrating Interactive Visualization With Automated Planning for Cooperative Resource Scheduling", Proceedings of International Conference on Knowledge Management and Knowledge Technologies (I-KNOW), Special Track on Theory and Applications of Visual Analytics (TAVA), pp. 44:1--44:8, 2011. paper
Alexander Rind, Wolfgang Aigner, Silvia Miksch, Silvia Wiltner, Margit Pohl, Thomas Turic, Felix Drexler, "Visual Exploration of Time-oriented Patient Data for Chronic Diseases: Design Study and Evaluation", Proceedings of USAB 2011: Information Quality in e-Health, pp. 301–320, 2011. paper