Comparative Evaluation of an Interactive Time-Series Visualization that Combines Quantitative Data with Qualitative Abstractions
Journal Article
|
|
| Teaser Image | |
| Author | |
| Abstract |
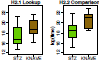
In many application areas, analysts have to make sense of large volumes of multivariate time-series data. Explorative analysis of this kind of data is often difficult and overwhelming at the level of raw data. Temporal data abstraction reduces data complexity by deriving qualitative statements that reflect domain-specific key characteristics. Visual representations of abstractions and raw data together with appropriate interaction methods can support analysts in making their data easier to understand. Such a visualization technique that applies smooth semantic zooming has been developed in the context of patient data analysis. However, no empirical evidence on its effectiveness and efficiency is available. In this paper, we aim to fill this gap by reporting on a controlled experiment that compares this technique with another visualization method used in the well-known KNAVE-II framework. Both methods integrate quantitative data with qualitative abstractions whereas the first one uses a composite representation with color-coding to display the qualitative data and spatial position coding for the quantitative data. The second technique uses juxtaposed representations for quantitative and qualitative data with spatial position coding for both. Results show that the test persons using the composite representation were generally faster, particularly for more complex tasks that involve quantitative values as well as qualitative abstractions.
|
| Keywords | |
| Year of Publication |
2012
|
| Journal |
Computer Graphics Forum
|
| Volume |
31
|
| Number of Pages |
995-1004
|
| Date Published |
06/2012
|
| ISSN Number |
0167-7055
|
| DOI | |
| reposiTUm Handle | |
| Original Publication |
The definitive version is available at http://diglib.eg.org/ and http://onlinelibrary.wiley.com/ .
|
| Funding projects | |
| Paper | |
| Download citation |