Home
Centre for Visual Analytics Science and Technology

Welcome to the CVAST Homepage!

The research unit "Visual Analytics" # 193-07 (Centre for Visual Analytics Science and Technology (CVAST)) is part of Vienna University of Technology (TU Wien), Faculty of Informatics, Institute of Visual Computing and Human-Centered Technology. CVAST conducts research and provides teaching in Visualization (Information Visualization, Visual Analytics). Read More


Ongoing Projects

KAVis: Visual Interactive Space-Time Segmentation
SANE: ViSual ANalytics for Event-based Diffusion on Networks
Visual Analytics and Computer Vision Meet Cultural Heritage
ArtVis Dynamic Network Perspectives on Digital Art History
DoRIAH Logo DoRIAH: Domain-adaptive Remote sensing Image Analysis with Human-in-the-loop
a circle with three dots in the position of an upward-pointing triangle, the bottom two dots are connected by an arc GuidedVA: Guidance-Enriched Visual Analytics for Temporal Data

More

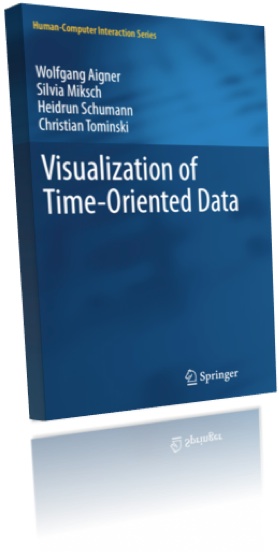
TimeVis: Book about "Visualization of Time-Oriented Data" InfoVis:Wiki - the Information Visualization community platform

infovis-wiki-logo

Main menu

Show — Main menu Hide — Main menu
  • Homepage
  • News
  • Partners
  • Team
  • Projects
  • Publications
  • Theses
    • PhD Theses
    • Master Theses
  • Teaching
    • Open Student Topics
    • Guidelines for Students
  • Research Tips
  • CVAST YouTube channel
  • Contact
    • How to find us

Search

Where to find us

Vienna University of Technology (TU Wien)
Faculty of Informatics
Institute of Visual Computing & Human-Centered Technology
Favoritenstrasse 9-11/193, A-1040 Vienna, Austria


TU Wien - Fakultät für Informatik

Datenschutzerklärung
Impressum

Log in

Show — Log in Hide — Log in
  • Log in

News

Breaking News from the Data Mines!

Dagstuhl Seminar 25152 Explores Visual Process Mining Synergies
April 6–11, 2025 — Schloss Dagstuhl, Germany

Bringing together experts in Process Mining (PM) and Visual Analytics (VA), the Dagstuhl Seminar “Multi-Faceted Visual Process Mining and Analytics” focused on bridging two complementary fields. Over the course of the week, participants tackled challenges in exploring and visualizing complex, multi-faceted process data—including time, space, uncertainty, and provenance.

Pandemic Projects & Visualization Insights from Dagstuhl

Empowering Communities: Tailored Pandemic Data Visualization for Varied Tasks and Users

Authors: Tom Baumgartl, Mohammad Ghoniem, Tatiana von Landesberger, G. Elisabeta Marai, Silvia Miksch, and Sibylle Mohr
 

Research Internship at NII: Ignacio Joins the "Kokatsuji" Digital Humanities Project

We are delighted to announce that Ignaciohas joined as a research intern at the National Institute of Informatics (NII), Tokyo, working under the guidance of Prof. Asanobu Kitamoto on the “Kokatsuji” digital humanities project.

HoloGraphs: Where Networks Take Shape

HoloGraphs: An Interactive Physicalization for Dynamic Graphs

Authors: Daniel Pahr, Henry Ehlers, Velitchko Filipov


Bringing Dynamic Networks into the Physical Realm at IVAPP 2025 in Porto, Portugal. We’re taking network visualization beyond the digital screen. HoloGraphs, our interactive physicalization for dynamic graphs, makes evolving networks tangible using transparent materials-it offers an intuitive way to explore temporal structures-no holodeck required.


New Publication!🚦Lost in Time? Study Reveals the Best Way to Navigate Dynamic Maps! 🗺️

Navigating a city during rush hour feels like solving a puzzle where the pieces keep moving. But fear not! A team of researchers—Annika Bonerath, Claus-Christian Carbon, Silvia Miksch, Maurizio Patrignani, and Alessandra Tappini—has cracked the code on time-dependent route planning in a recently published study in Perception in Network Visualization.

Powered by Drupal