|
Markus Bögl, Wolfgang Aigner, Peter Filzmoser, Theresia Gschwandtner, Tim Lammarsch, Silvia Miksch, Alexander Rind, "Visual Analytics Methods to Guide Diagnostics for Time Series Model Predictions",
Proceedings of the 2014 IEEE VIS Workshop on Visualization for Predictive Analytics, 2014.
|

|
Tim Lammarsch, Wolfgang Aigner, Silvia Miksch, Alexander Rind, "Showing Important Facts to a Critical Audience by Means Beyond Desktop Computing",
Death of the Desktop - Workshop co-located with IEEE VIS 2014, 2014.
|
|
Michael Smuc, Paolo Federico, Florian Windhager, Wolfgang Aigner, Lukas Zenk, Silvia Miksch, "How Do You Connect Moving Dots? Insights from User Studies on Dynamic Network Visualizations",
Handbook of Human Centric Visualization, pp. 623-650, 2013.
|

|
Alexander Rind, Taowei Wang, Wolfgang Aigner, Silvia Miksch, Krist Wongsuphasawat, Catherine Plaisant, Ben Shneiderman, "Interactive Information Visualization to Explore and Query Electronic Health Records",
Foundations and Trends in Human-Computer Interaction, vol. 5, pp. 207-298, 2013.
|
|
Tim Lammarsch, Wolfgang Aigner, Alessio Bertone, Silvia Miksch, Alexander Rind, "Mind the Time: Unleashing the Temporal Aspects in Pattern Discovery",
Fourth International Eurovis Workshop on Visual Analytics held in Europe (EuroVA 2013), pp. 31-35, 2013.
|

|
David Riano, Richard Lenz, Silvia Miksch, Mor Peleg, Manfred Reichert, Annette Teije, "Process Support and Knowledge Representation in Health Care",
Lecture Notes in Artificial Intelligence, pp. 159, 2013.
|
|
Peter Bodesinsky, Paolo Federico, Silvia Miksch, "Visual Analysis of Compliance with Clinical Guidelines",
Proceedings of the 13th International Conference on Knowledge Management and Knowledge Technologies (i-KNOW), pp. 12:1–12:8, 2013.
|

|
Richard Lenz, Silvia Miksch, Mor Peleg, Manfred Reichert, David Riano, Annette Teije, "Process Support and Knowledge Representation in Health Care: BPM 2012 Joint Workshop, ProHealth 2012/KR4HC 2012",
Lecture Notes in Artificial Intelligence, 2013.
|

|
Silvana Quaglini, Yuval Shahar, Mor Peleg, Silvia Miksch, Carlo Napolitano, Mercedes Rigla, Angels Pallàs, Enea Parimbelli, Lucia Sacchi, "Supporting Shared Decision Making within the MobiGuide Project",
Proceedings of the AMIA Annual Symposium, pp. 1175-1184, 2013.
|
|
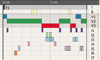
Tim Lammarsch, Wolfgang Aigner, Alessio Bertone, Markus Bögl, Theresia Gschwandtner, Silvia Miksch, Alexander Rind, "Interactive Visual Transformation for Symbolic Representation of Time-oriented Data",
Proceedings of the International Conference on Human Factors in Computing & Informatics (SouthCHI 2013), vol. 7947, pp. 400-419, 2013.
|

|
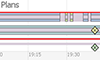
Alexander Rind, Tim Lammarsch, Wolfgang Aigner, Bilal Alsallakh, Silvia Miksch, "TimeBench: A Data Model and Software Library for Visual Analytics of Time-Oriented Data",
IEEE Transactions on Visualization and Computer Graphics, Special Issue "VIS 2013", vol. 19, pp. 2247-2256, 2013.
Project page Introduction and Basic Features |

|
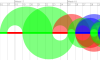
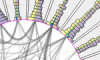
Bilal Alsallakh, Wolfgang Aigner, Silvia Miksch, Helwig Hauser, "Radial Sets: Interactive Visual Analysis of Large Overlapping Sets",
IEEE Transactions on Visualization and Computer Graphics (Proceedings of InfoVis), vol. 19, pp. 2496-2505, 2013.
More details and online demos The visual and interaction metaphors |

|
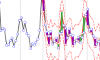
Markus Bögl, Wolfgang Aigner, Peter Filzmoser, Tim Lammarsch, Silvia Miksch, Alexander Rind, "Visual Analytics for Model Selection in Time Series Analysis",
IEEE Transactions on Visualization and Computer Graphics, Special Issue "VIS 2013", vol. 19, pp. 2237 - 2246, 2013.
Video Introduction with audio narration |

|
Wolfgang Aigner, Paolo Federico, Theresia Gschwandtner, Silvia Miksch, Alexander Rind, "Challenges of Time-oriented Data in Visual Analytics for Healthcare",
IEEE VisWeek Workshop on Visual Analytics in Healthcare , pp. 4, 2012.
|
|
Margit Pohl, Silvia Wiltner, Silvia Miksch, Wolfgang Aigner, Alexander Rind, "Analysing Interactivity in Information Visualisation",
KI - Künstliche Intelligenz, vol. 26, pp. 151-159, 2012.
|
|
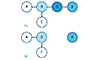
Paolo Federico, Wolfgang Aigner, Silvia Miksch, Florian Windhager, Michael Smuc, "Vertigo Zoom: Combining Relational and Temporal Perspectives on Dynamic Networks",
Proceedings of the 11th International Working Conference on Advanced Visual Interfaces (AVI2012), pp. 437-440, 2012.
|
|
Bilal Alsallakh, Peter Bodesinsky, Silvia Miksch, Dorna Nasseri, "Visualizing Arrays in the Eclipse Java IDE",
16th European Conference on Software Maintenance and Reengineering, pp. 541-544, 2012.
http://youtu.be/7gTv9yUtFBc |
|
Bilal Alsallakh, Peter Bodesinsky, Alexander Gruber, Silvia Miksch, "Visual Tracing for the Eclipse Java Debugger",
16th European Conference on Software Maintenance and Reengineering, pp. 545-548, 2012.
Screencast |

|
David Riano, Annette Teije, Silvia Miksch, "Knowledge Representation for Health-Care: AIME 2011 Workshop KR4HC 2011: Revised Selected Papers",
Lecture Notes in Artificial Intelligence, vol. 6924, pp. 171, 2012.
|
|
Alexander Rind, Barbara Neubauer, Wolfgang Aigner, Silvia Miksch, "Static and Dynamic Visual Mappings to Explore Bivariate Data Across Time",
EuroVA 2012 Poster Proceedings, pp. 3, 2012.
|

|
Paolo Federico, Wolfgang Aigner, Silvia Miksch, Jürgen Pfeffer, Michael Smuc, Florian Windhager, Lukas Zenk, "ViENA: Visual Enterprise Network Analytics",
Poster Proceedings of the 3rd International Workshop on Visual Analytics (EuroVA), pp. 12, 2012.
|
|
Paolo Federico, Jürgen Pfeffer, Wolfgang Aigner, Silvia Miksch, Lukas Zenk, "Visual Analysis of Dynamic Networks using Change Centrality",
Proceedings of the International Conference on Advances in Social Networks Analysis and Mining (ASONAM), pp. 179 - 183, 2012.
|

|
Florian Windhager, Michael Smuc, Lukas Zenk, Paolo Federico, Jürgen Pfeffer, Wolfgang Aigner, Silvia Miksch, "Visual Knowledge Networks Analytics",
Knowledge Management Handbook, pp. 187–206, 2012.
paper |
|
Bilal Alsallakh, Wolfgang Aigner, Silvia Miksch, Eduard Gröller, "Reinventing the Contingency Wheel: Scalable Visual Analytics of Large Categorical Data",
IEEE Transactions on Visualization and Computer Graphics (Proceedings of IEEE VAST 2012), vol. 18, pp. 2849-2858, 2012.
Visual and interaction metaphors of Contingency Wheel++ (5 min) |
|
Theresia Gschwandtner, Johannes Gärtner, Wolfgang Aigner, Silvia Miksch, "A Taxonomy of Dirty Time-Oriented Data",
Lecture Notes in Computer Science (LNCS 7465): Multidisciplinary Research and Practice for Information Systems (Proceedings of the CD-ARES 2012), pp. 58 -- 72, 2012.
|