Capturing and Visualizing Provenance From Data Wrangling
Journal Article
|
|
| Teaser Image | |
| Author | |
| Editor | |
| Abstract |
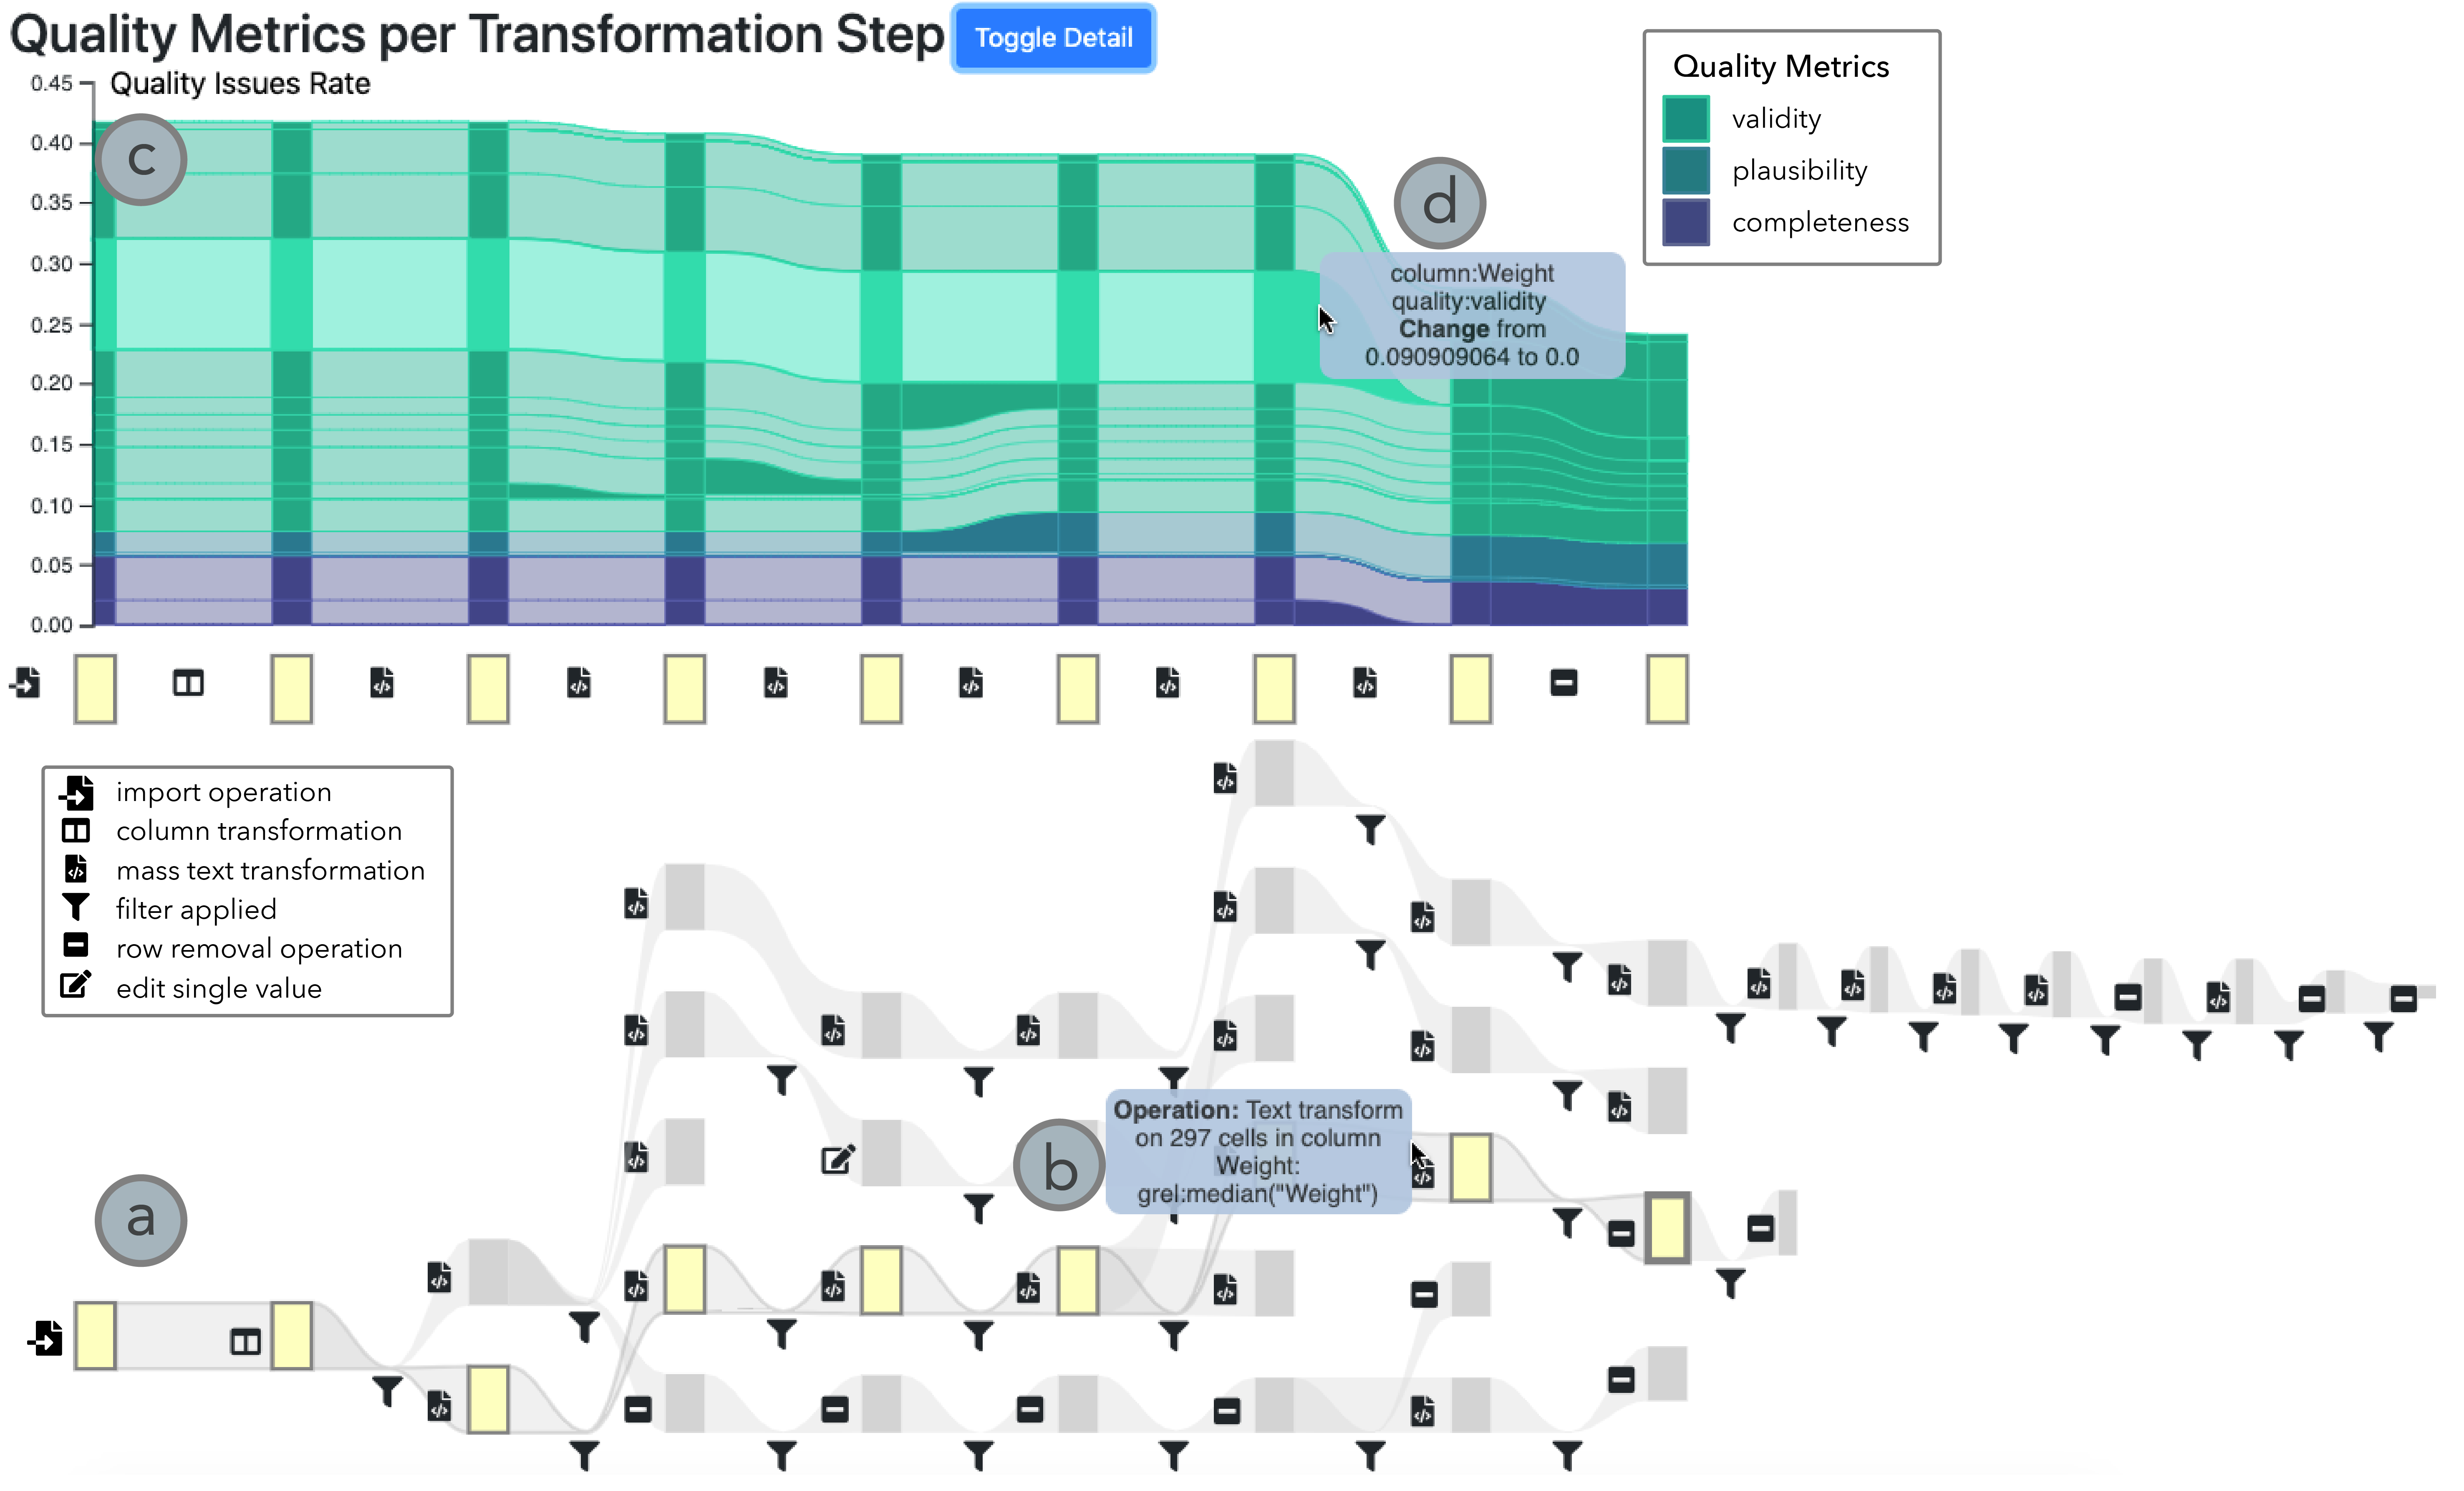
Data quality management and assessment play a vital role for ensuring the trust in the data and its fitness-of-use for subsequent analysis. The transformation history of a data wrangling system is often insufficient for determining the usability of a dataset, lacking information how changes affected the dataset. Capturing workflow provenance along the wrangling process and combining it with descriptive information as data provenance can enable users to comprehend how these changes affected the dataset, and if they benefited data quality. We present DQProv Explorer, a system that captures and visualizes provenance from data wrangling operations. It features three visualization components: allowing the user to explore the provenance graph of operations and the data stream, the development of quality over time for a sequence of wrangling operations applied to the dataset, and the distribution of issues across the entirety of the dataset to determine error patterns.
|
| Keywords | |
| Year of Publication |
2019
|
| Journal |
IEEE Computer Graphics and Applications
|
| Volume |
39
|
| Start Page |
61
|
| Issue |
6
|
| Number of Pages |
15
|
| Date Published |
11/2019
|
| ISSN Number |
1558-1756
|
| DOI | |
| reposiTUm Handle | |
| Funding projects | |
| Paper | |
| Attachments | |
| Download citation |