VoD - Understanding Structure, Content, and Quality of a Dataset
Conference Paper
|
|
| Teaser Image | |
| Author | |
| Abstract |
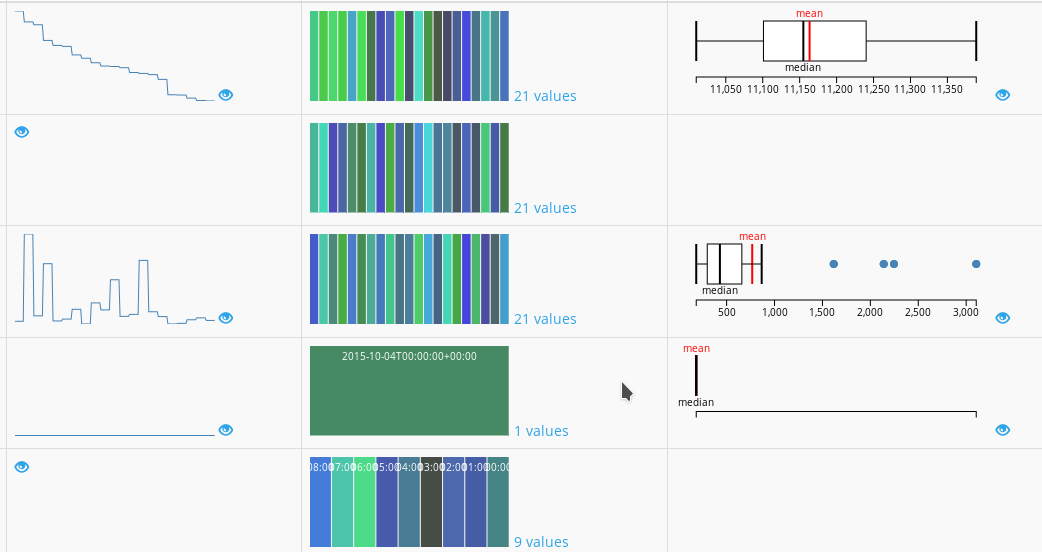
In the age of data science analysts need to handle new data sets on a daily basis. In a first step they need to understand structure, content, and if the dataset is fit-for-use for further processing. However, getting familiar with a dataset by simply scrolling through the data in tabular form is just not feasible for these usually very large sets of data. Thus, we have designed and evaluated a Visual Analytics prototype that provides interactive visual summaries of a dataset on three different levels: the dataset level, the data attribute level, and the data value level. Our results demonstrate the usefulness of our approach and point to further research challenges.
|
| Year of Publication |
2018
|
| Conference Name |
IEEE VIS Workshop on Visual Summarization and Report Generation: Beyond Scatter-Plots and Bar-Charts (VISREG 2018)
|
| Publisher |
IEEE Xplore Digital Library
|
| Conference Location |
Berlin, Germany
|
| reposiTUm Handle | |
| Funding projects | |
| Paper | |
| Supplementary Material | |
| Download citation |