Visualizing Multiple Types of Uncertainty
Problem
Aggregating and propagating uncertainty is vital to adequately select data processing methods for time series analysis. Machine learning and data mining processes can be applied but need to be used properly to not influence the outcome.
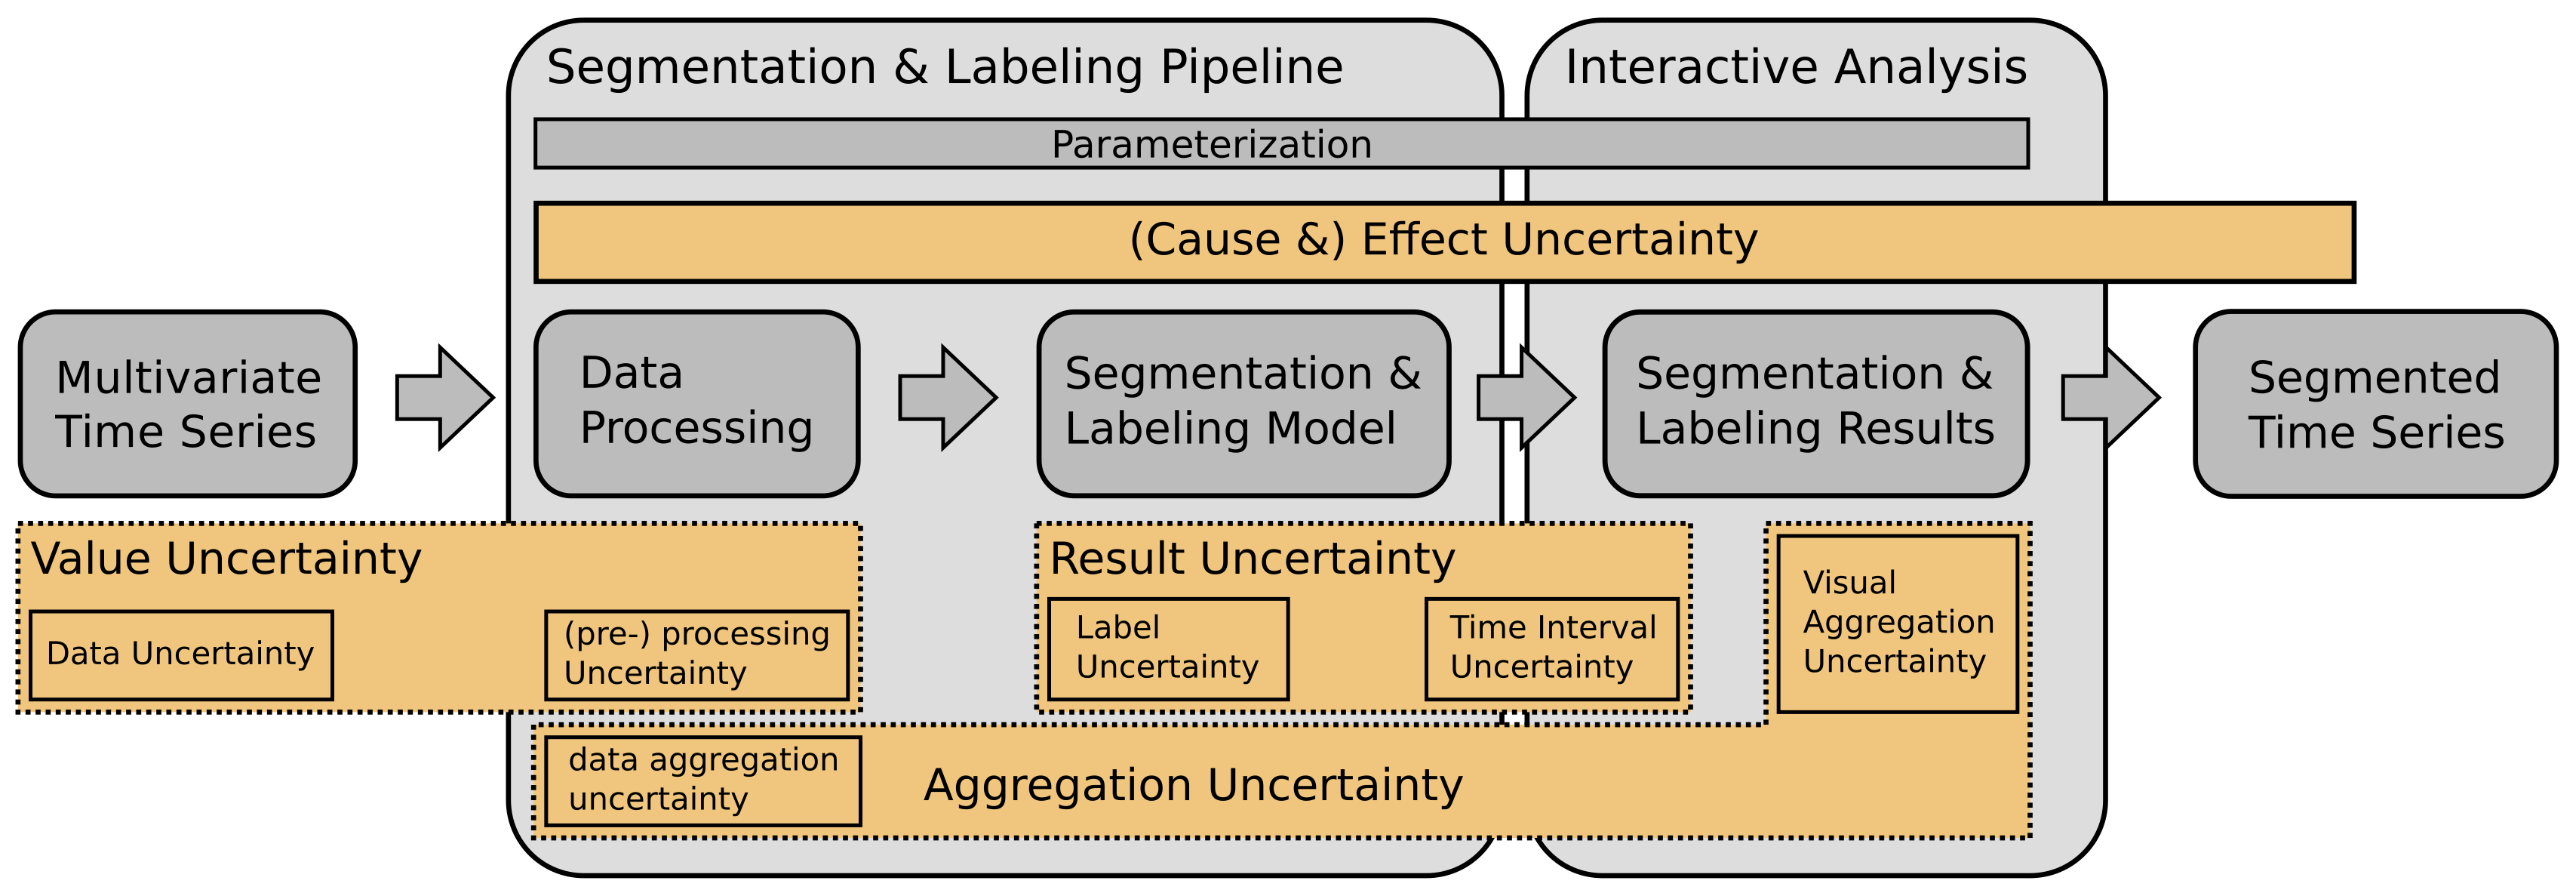
We have identified different types of uncertainties that are introduced at different stages of the analysis pipeline. These uncertainties need to be appropriately communicated to the user. Being aware of these introduced uncertainties can help the user to select the best processing algorithm for analysis.
Aim
We aim to develop a new technique for displaying different types of uncertainty in a time series visualization.
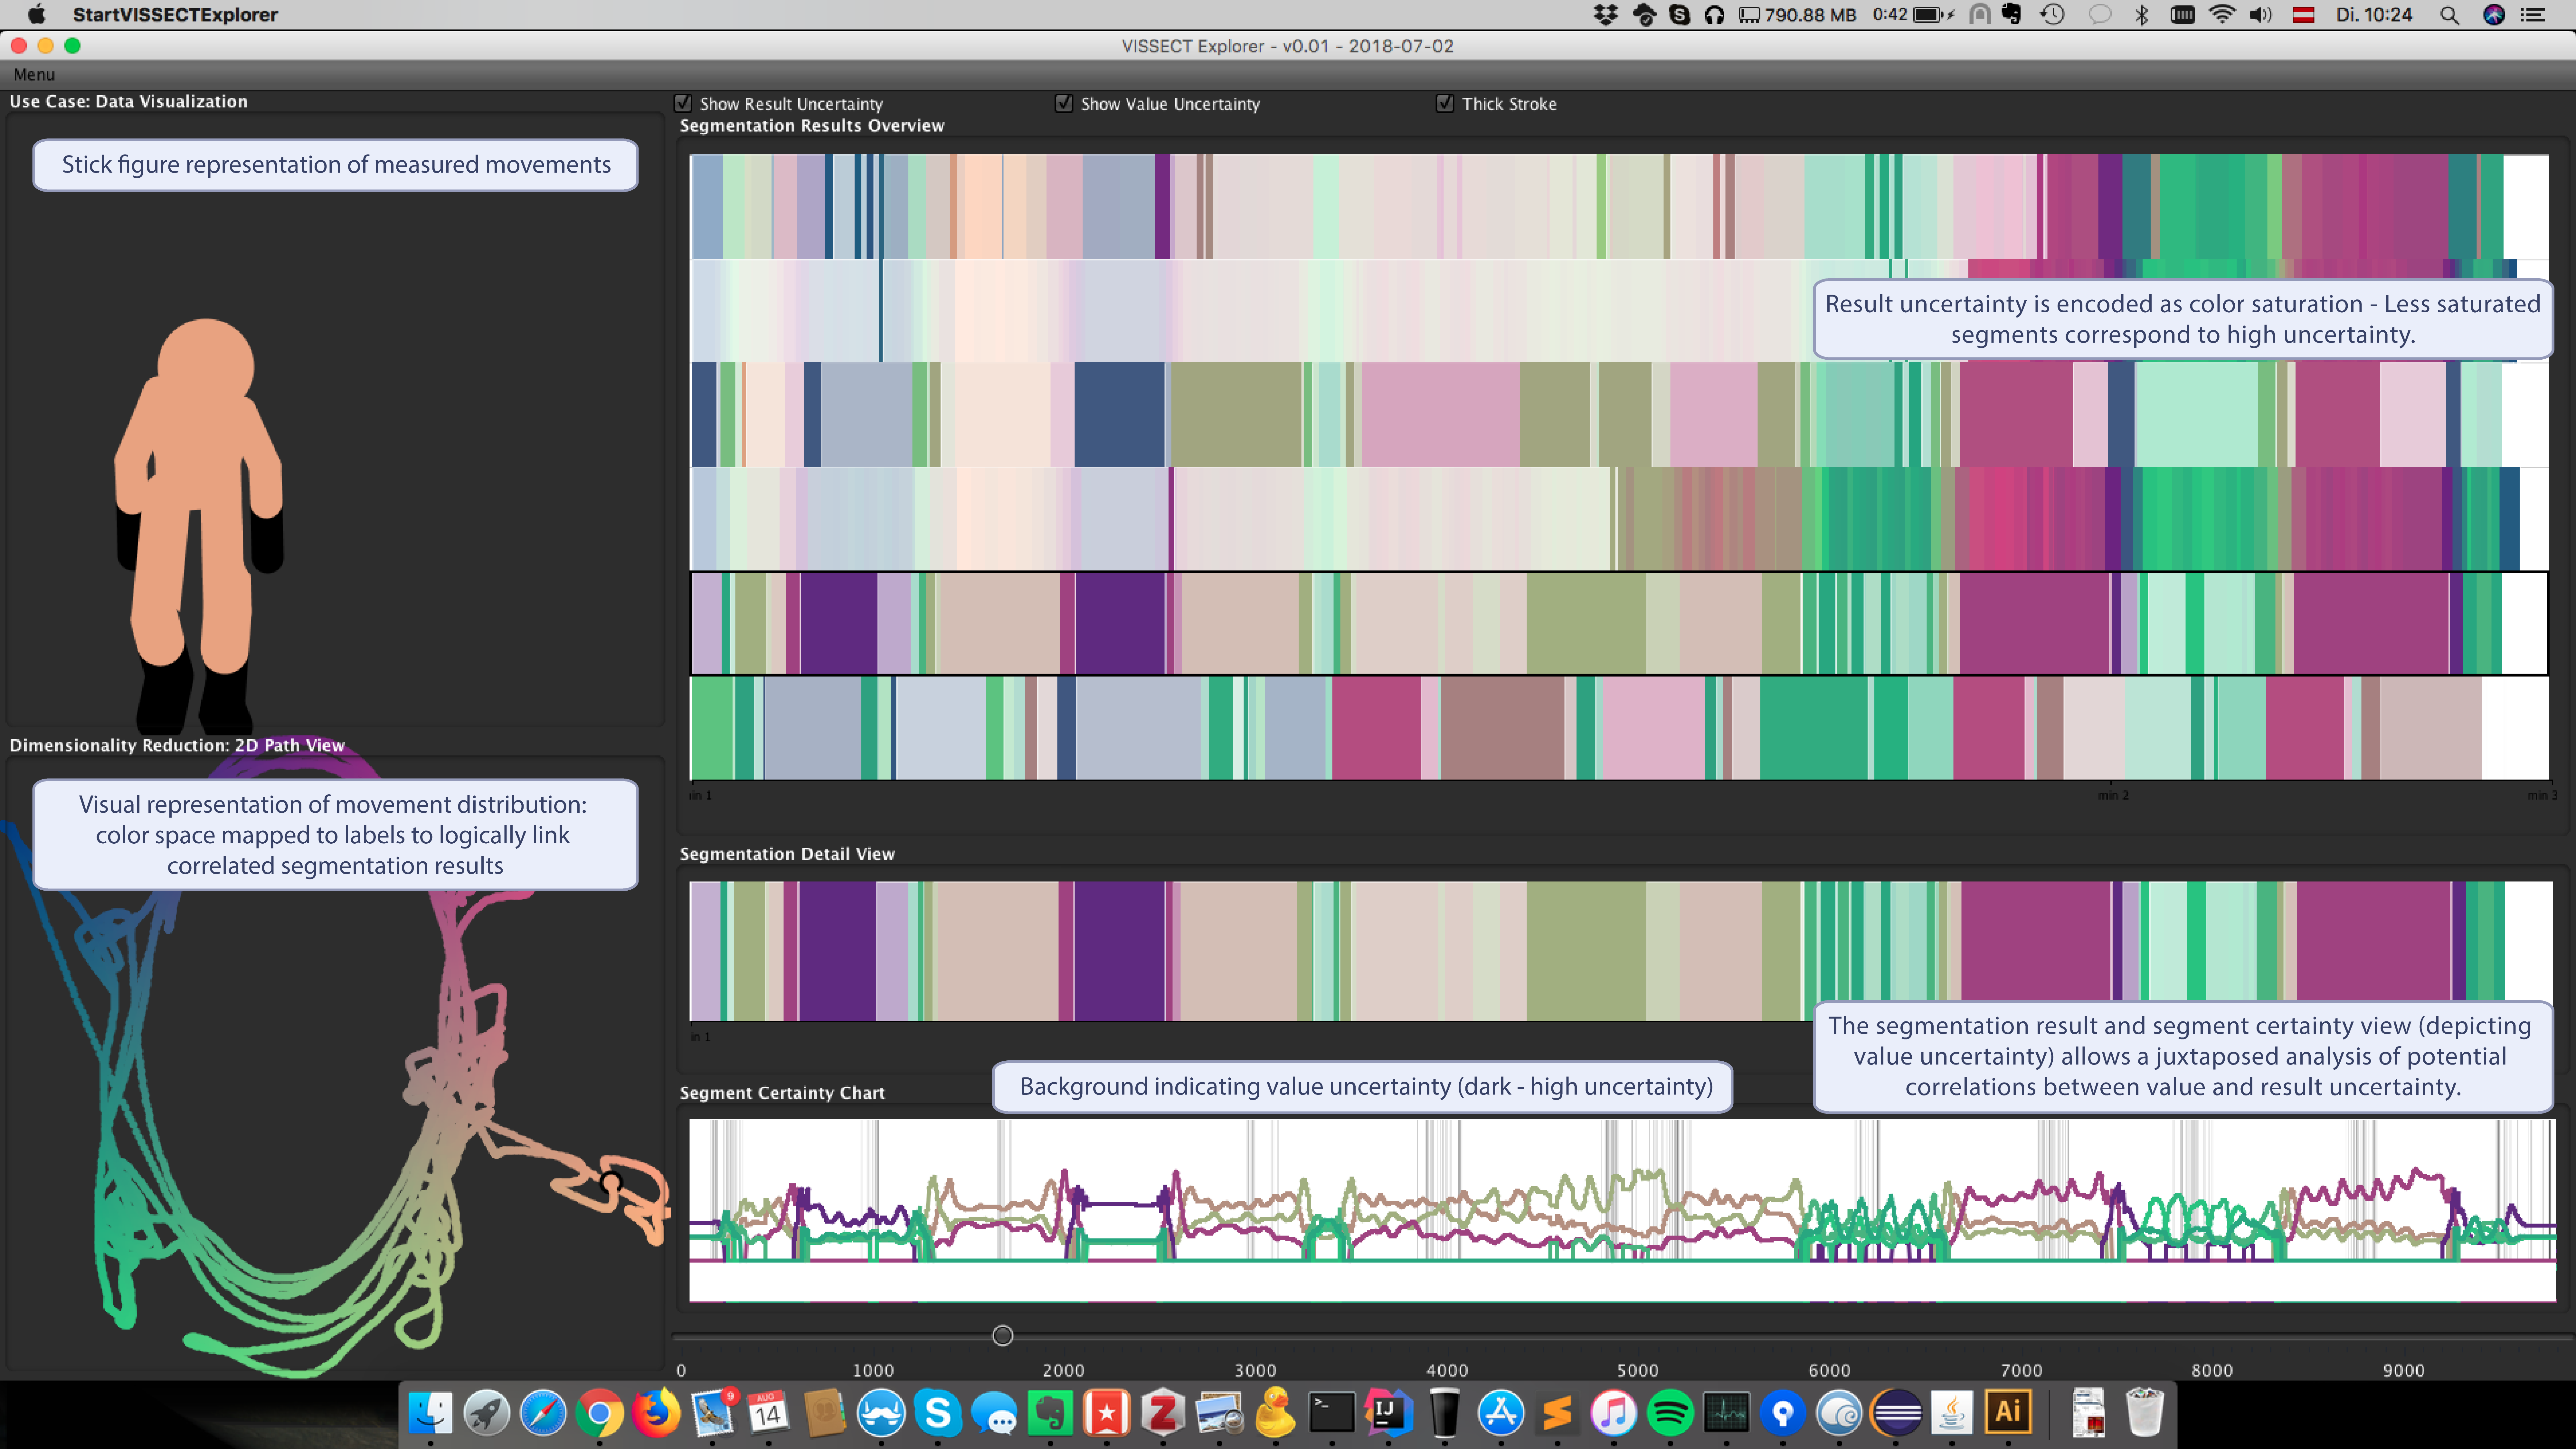
The basis of this visualization is an application that shows computed segments and labels of motion capturing data. The visualization should combine multiple types of uncertainties into a composite visual element that is integrable into the currently existing visualization environment.
Other information
This environment is based on a JPanel (Java) implementation that features all necessary data and basic visualization techniques. The implementation will be supported by the rest of the development team and the student can work on a highly iterative and dynamic project and can contribute his/her own ideas to the project.
Attached you can also find the current state of the development prototype, including an overview of the various visual elements.