Visualization of Money Flows in Blockchain Transaction Networks
Problem
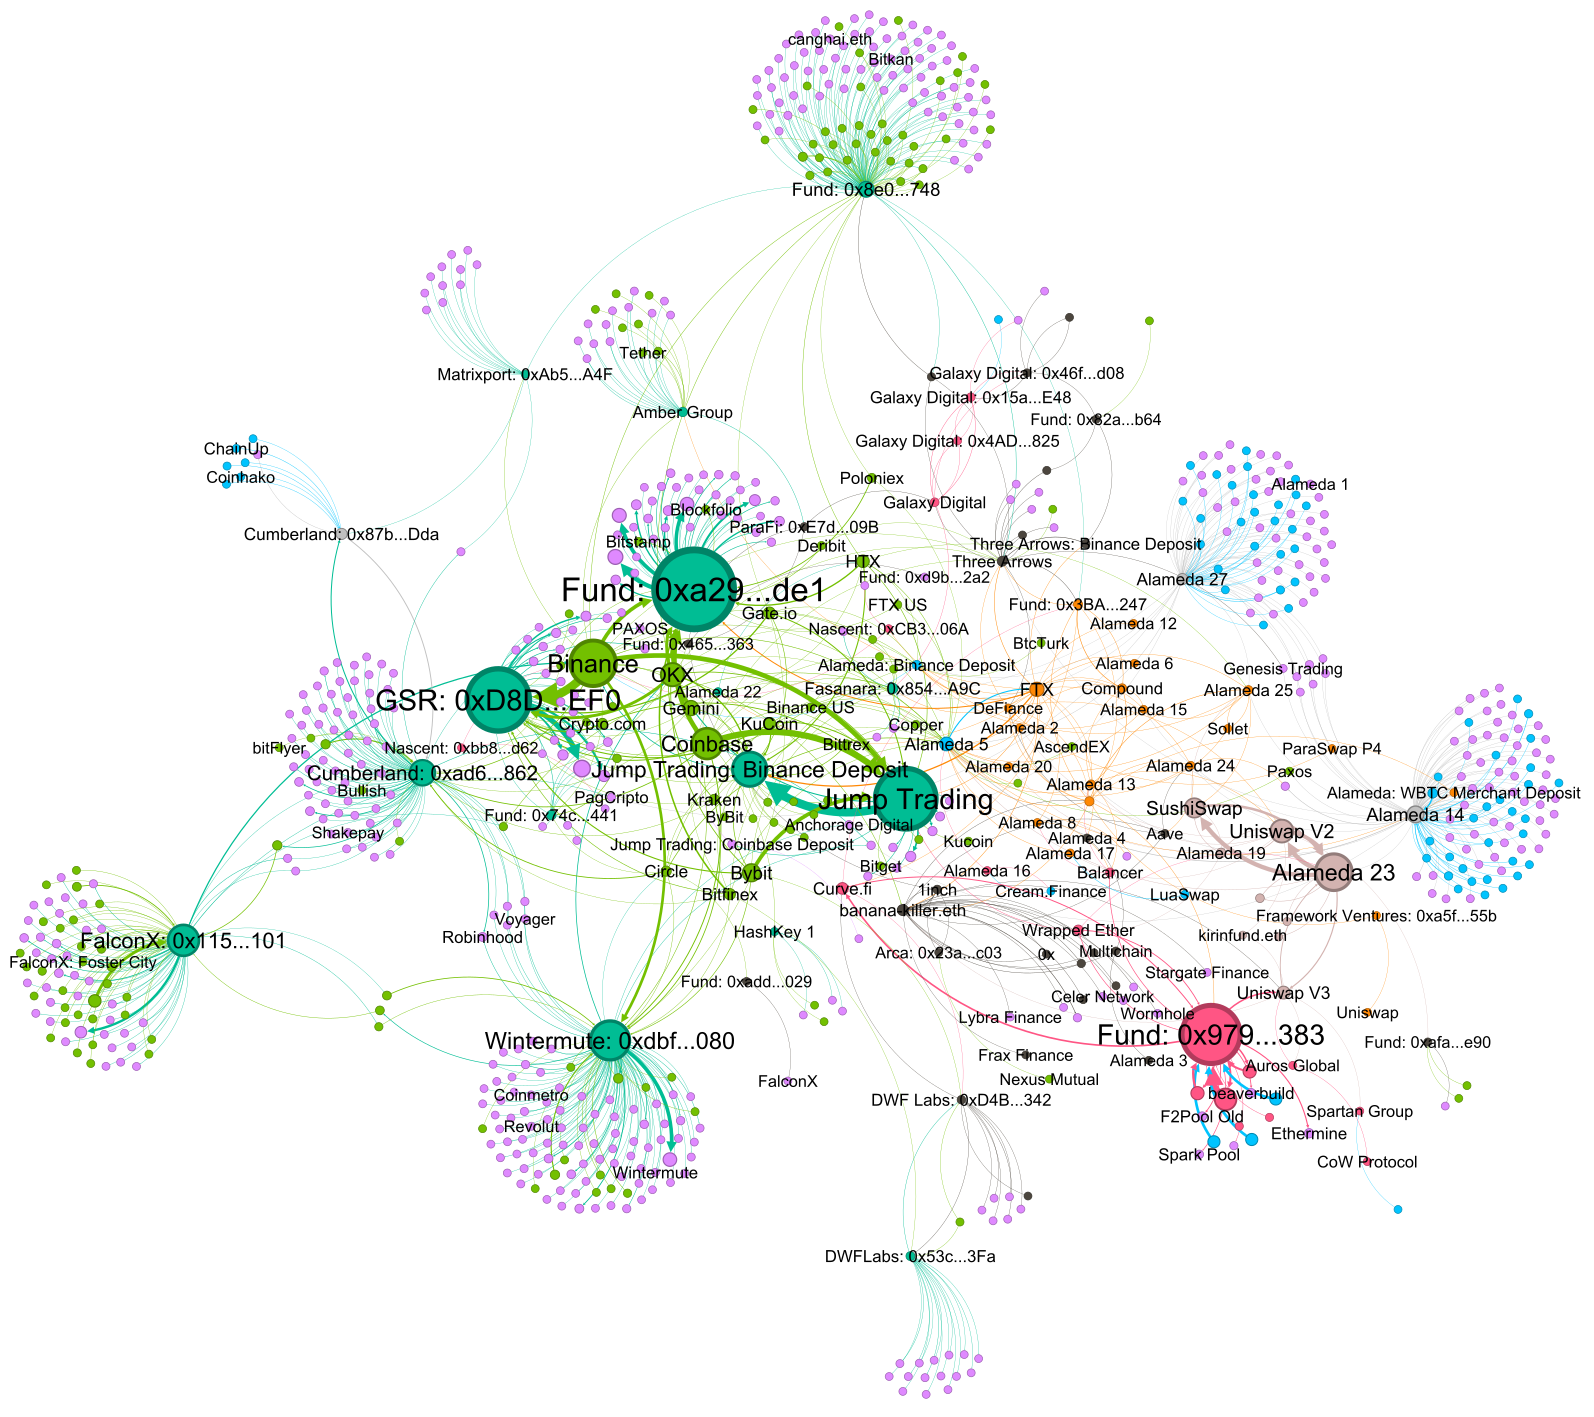
Blockchain networks record vast volumes of transactional data in an open and immutable ledger. However, the transparency promised by this data is limited by its complexity and low-level structure. Tokens freely move between cryptographic addresses without clear indications of ownership, purpose, or context. As a result, understanding how money flows through decentralized finance (DeFi) protocols, tracing illicit activity, or analyzing user behavior at scale remains a significant challenge. Current visualization tools often fail to capture the structural and temporal dynamics of these flows, making it difficult for researchers, regulators, and users to gain actionable insights from the data.
Aim
The student will start by reviewing existing visualization methods for blockchain data, extending to financial transaction networks and money flows, to examine the strengths and limitations of current visualization tools in this domain. Building on this foundation, the student will develop an interactive visualization for analyzing money flows within cryptocurrency transaction networks, with a particular focus on DeFi applications. The resulting tool will enable users to track the movement of digital assets over time, exploring macro-level trends and micro-level behaviors, as well as detecting anomalous and illicit activities within the blockchain ecosystem.

Other information
References
- Akcora, C. G., Gel, Y. R., & Kantarcioglu, M. (2022). Blockchain Networks: Data structures of Bitcoin, Monero, Zcash, Ethereum, Ripple, and Iota. Wiley Interdisciplinary Reviews: Data Mining and Knowledge Discovery, 12(1), e1436. https://wires.onlinelibrary.wiley.com/doi/full/10.1002/widm.1436
- Tovanich, N., Coquidé, C., & Cazabet, R. (2025). Cryptocurrency Network Analysis. arXiv preprint arXiv:2502.03411. https://arxiv.org/pdf/2502.03411
- Auer, R., Haslhofer, B., Kitzler, S., Saggese, P., & Victor, F. (2024). The Technology of Decentralized Finance (DeFi). Digital Finance, 6(1), 55-95. https://www.bis.org/publ/work1066.pdf
- Tovanich, N., Heulot, N., Fekete, J. D., & Isenberg, P. (2019). Visualization of Blockchain Data: A Systematic Review. IEEE Transactions on Visualization and Computer Graphics, 27(7), 3135-3152. https://hal.science/hal-02426339/file/blockchain_visualization_review_revised.pdf
- Coquidé, C., Cazabet, R., & Tovanich, N. (2024, December). Inside Alameda Research: A Multi-token Network Analysis. In International Conference on Complex Networks and Their Applications (pp. 200-212). Cham: Springer Nature Switzerland. https://hal.science/hal-04727905/file/CNA_2024___Ego_Network_Analysis.pdf
- Tovanich, N., & Cazabet, R. (2023). Fingerprinting Bitcoin entities using money flow representation learning. Applied Network Science, 8(1), 63. https://appliednetsci.springeropen.com/articles/10.1007/s41109-023-00591-2
- Napoli, E. A., Tovanich, N., & Gatteschi, V. (2025, June). DeFi-Vis: Visual Analytics for Exploring Decentralized Finance Trading Activities. In IEEE International Conference on Blockchain and Cryptocurrency (ICBC 2025). https://hal.science/hal-05029081v1/document
- BitcoinVis: Visualization of Bitcoin Blockchain Data https://www.aviz.fr/Research/BitcoinVis