Visualization and Imputation of Cyclic/Seasonal Time Series
Problem
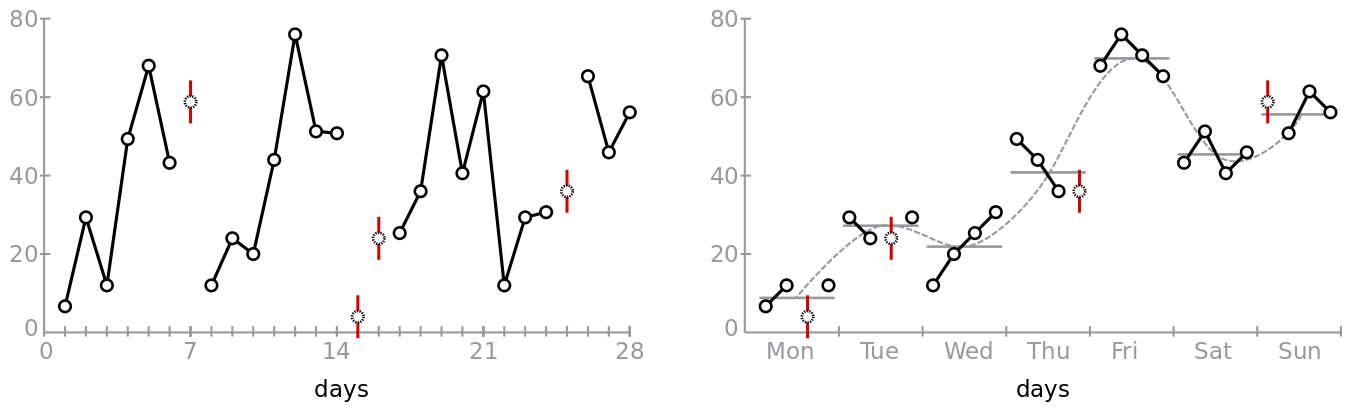
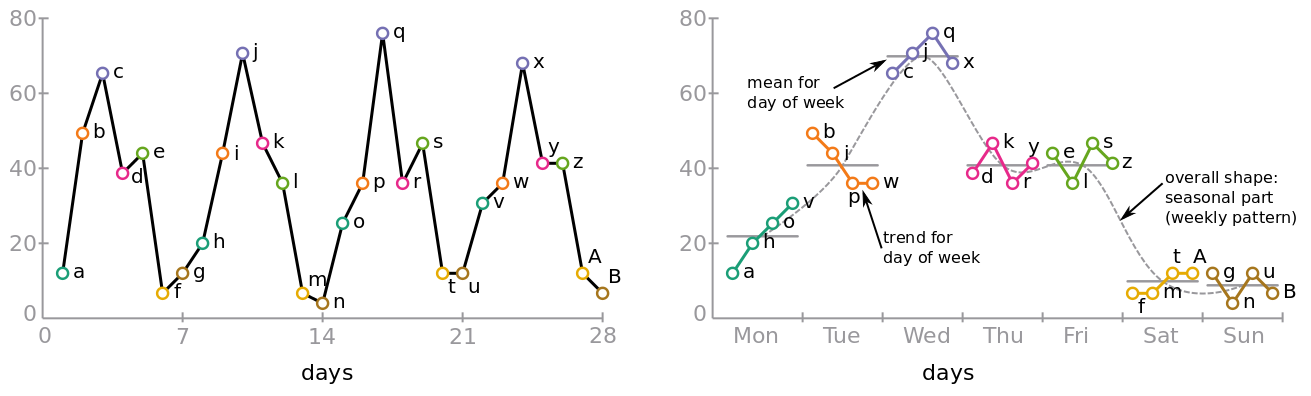
Missing values are a problem in many real world applications, for example failing sensor measurements. For further analysis these missing values need to be imputed. Thus, imputation of such missing values is important in a wide range of applications. We propose a visually and statistically guided imputation approach, that allows applying different imputation techniques to estimate the missing values as well as evaluating and fine tuning the imputation by visual guidance. In our approach we include additional visual information about uncertainty and employ the cyclic structure of time inherent in the data. Including this cyclic structure enables visually judging the adequateness of the estimated values with respect to the uncertainty/error boundaries and according to the patterns of the neighbouring time points in linear and cyclic (e.g., the months of the year) time.
Aim
You should provide a systematic overview of existing approaches in scientific literature for visualizing cyclic/seasonal time series and approaches for visualizing missing values. For a thesis, you should provide ideas on how these can be combined and provide an implementation in an interactive research prototype.