Uncertainty Visualization
Problem
Visualizations of data distributions are a key part of decision-making under uncertainty. And uncertainty, in turn, is everywhere: What's the chance that it rains tomorrow? How certain is it that the water level in a flooding event will exceed a given height? Who will win an election? However, visualizations of uncertainty, while widely being researched, are still not perfectly understood.
Aim
SE: Collect and present scientific literature about a particular uncertainty visualization.
BA/MA: Design, run, and report on an experiment that evaluates an uncertainty visualization.
(All of the above to be specified in more detail with your supervisor.)
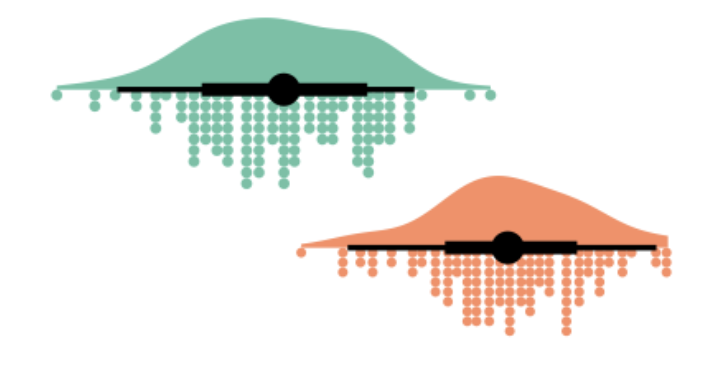
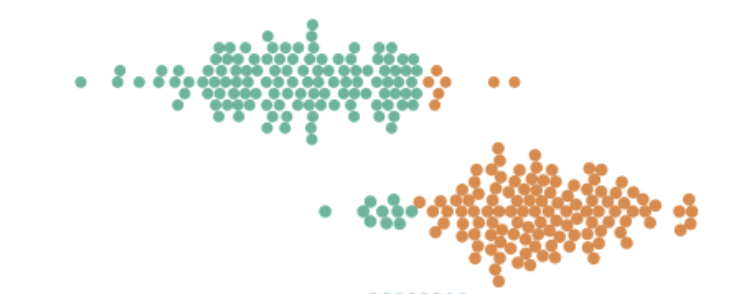
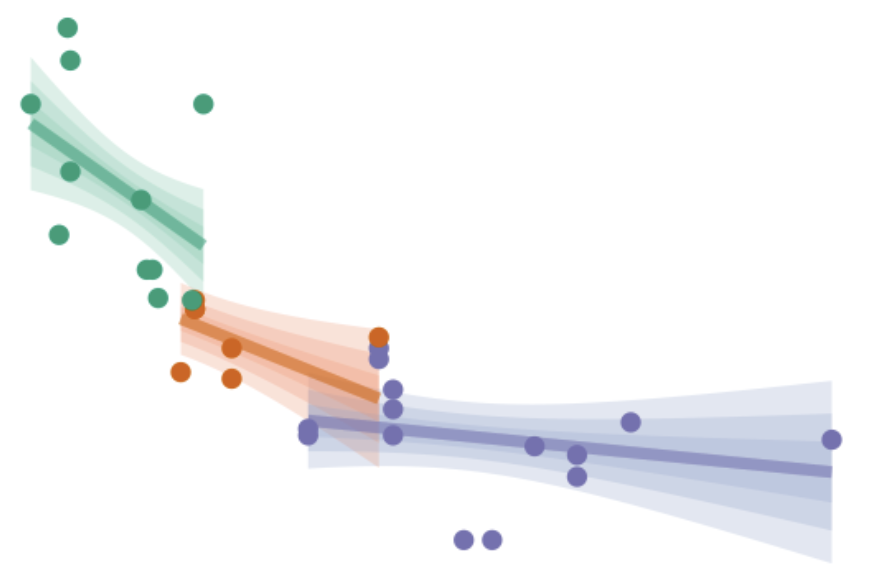
Gallery
Other information
References
- J. Hullman, X. Qiao, M. Correll, A. Kale, and M. Kay, “In Pursuit of Error: A Survey of Uncertainty Visualization Evaluation,” IEEE Transactions on Visualization and Computer Graphics, vol. 25, no. 1, pp. 903–913, Jan. 2019, doi: 10.1109/TVCG.2018.2864889.
- M. Kay, T. Kola, J. R. Hullman, and S. A. Munson, “When (ish) is My Bus?: User-centered Visualizations of Uncertainty in Everyday, Mobile Predictive Systems,” in Proceedings of the 2016 CHI Conference on Human Factors in Computing Systems, San Jose California USA: ACM, May 2016, pp. 5092–5103. doi: 10.1145/2858036.2858558.
Contact
Further information
Area
Information Visualization (IV)
Visual Analytics (VA)
English
Scope
SE
BA
PR
MA
Assigned as
Seminar work/Seminararbeit
Project page
Status
open