DeFiVis: Visual Analytics for Decentralized Finance Protocol
Problem
Decentralized Finance (DeFi) has emerged as a rapidly growing sector in blockchain ecosystems, offering financial services without intermediaries. Among these, decentralized lending protocols (e.g., Compound, Aave, MakerDAO) enable users to deposit collateral, borrow assets, and earn interest in a fully decentralized manner.
Blockchain technology provides unprecedented transparency, as all transactions are publicly available on-chain. This level of detail surpasses what is typically possible in traditional finance. However, the sheer volume, complexity, and technical nature of the data make it difficult for both users and analysts to interpret and act upon.
Visual analytics can bridge this gap by transforming raw blockchain data into interactive, intuitive representations. Such tools can help users monitor their financial positions and support analysts and researchers in exploring protocol activities, systemic risks, and market dynamics.
Aim
The student will gain domain knowledge on Decentralized Finance (DeFi) and blockchain data, with a particular focus on decentralized lending protocols (e.g., Aave and Compound). As part of the project, the student will first conduct a systematic survey of financial and risk visual analytics approaches to inform the design.
The main goal of this project is to design and develop a visual analytics system that supports monitoring and exploration of a DeFi lending protocol. Depending on the student’s interest, the project may focus on one or more of the following directions:
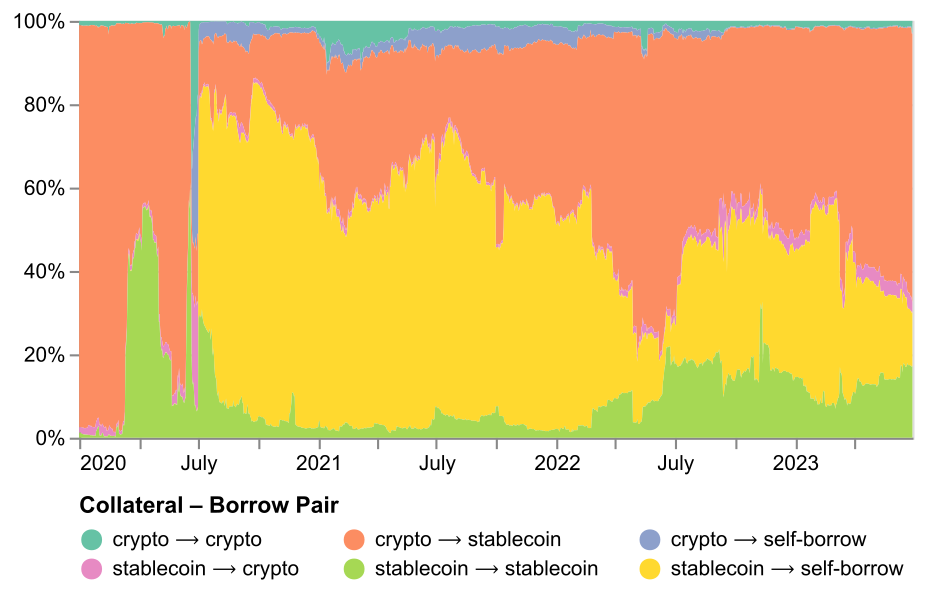
- Historical Analysis: Visualize protocol events such as borrow/lend transactions, liquidations, or interest rate changes over time. The aim is to analyze the factors driving aggregated events and allow drill-down to individual user actions.
- Users and Protocol Monitoring: Build a dashboard to track user positions and health factors, issue warnings when accounts are at risk of liquidation, or identify opportunities for liquidators.
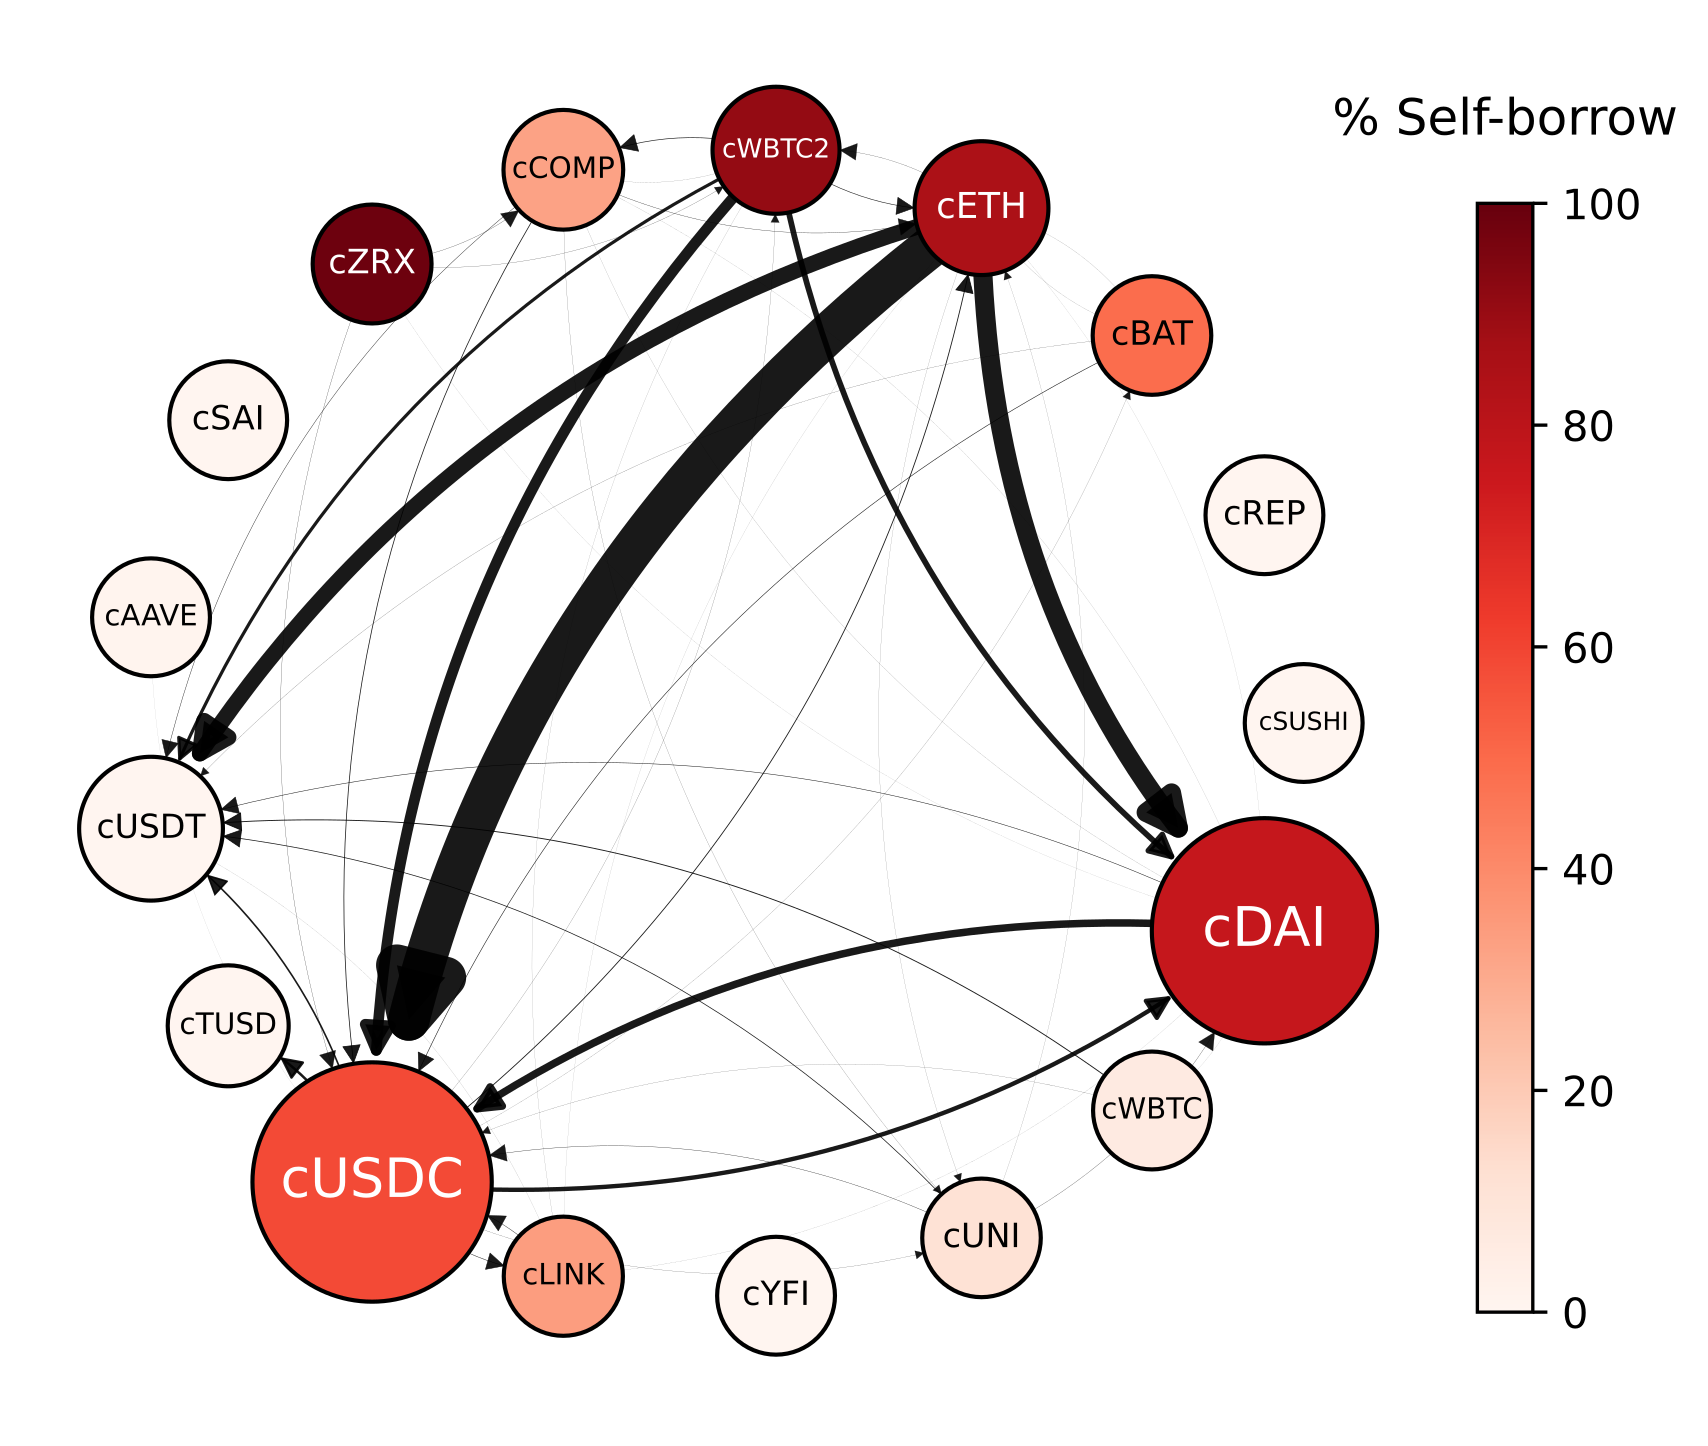
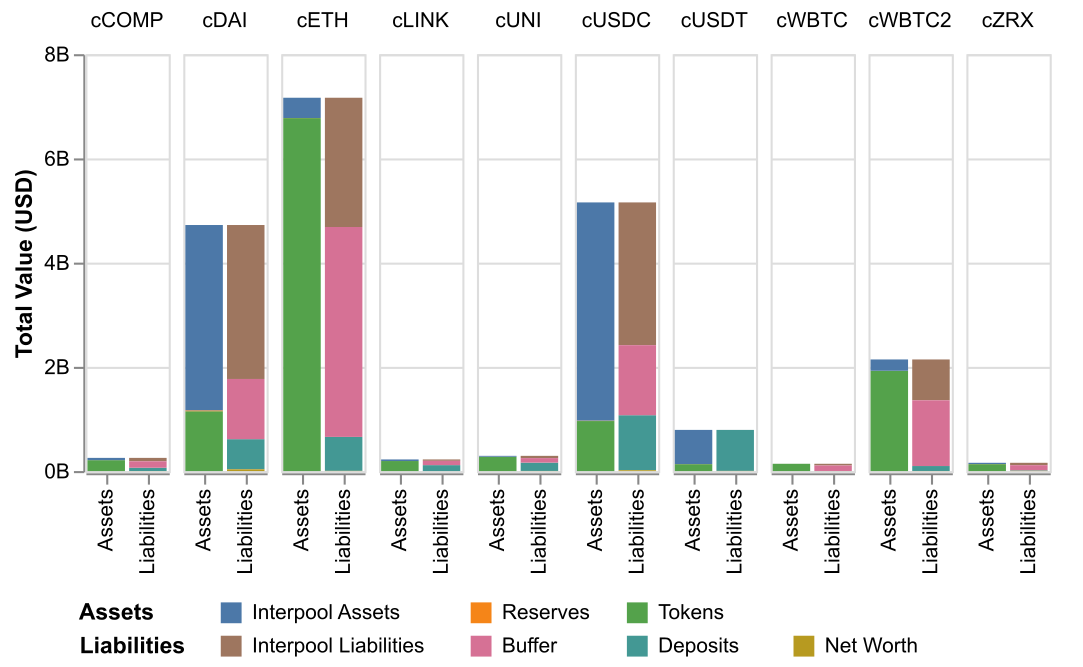
- Systemic Risk Analysis: Develop visualizations to display how shocks (e.g., sudden price changes) propagate through the protocol and affect users, lending pools, and assets.
The project aims to produce a practical visual analytics tool that can be applied to real-world DeFi data, helping users, researchers, and developers to understand the dynamics and risks in DeFi ecosystems.
Other information
Qualifications
- Interest in blockchain data and network analysis
- Proficiency in Python and Jupyter Notebook for data exploration and analysis
- Some background and experience in web application development (e.g., React and Next.js)
- Familiarity with web-based visualization libraries such as Vega, Vega-Lite, or D3.js (or willingness to learn them)
Background Readings and References
- Decentralized Finance MOOC https://defi-learning.org/f22
- Auer, R., Haslhofer, B., Kitzler, S., Saggese, P., & Victor, F. (2024). The Technology of Decentralized Finance (DeFi). Digital Finance, 6(1), 55-95. https://www.bis.org/publ/work1066.pdf
- Aave Protocol Documentation https://aave.com/docs
- Gauntlet Team (2018). Aave Market Risk Assessment. Online: https://www.gauntlet.xyz/resources/aave-market-risk-assessment
- Tovanich, N., Kassoul, M., Weidenholzer, S., & Prat, J. (2023). Contagion in Decentralized Lending Protocols: A Case Study of Compound. In Proceedings of the 2023 Workshop on Decentralized Finance and Security (pp. 55-63). https://hal.science/hal-04221228/document
- Tovanich, N., Marcassa, S., Kitzler, S., Makridis, C. & Prat, J. (2025). Shock Propagation in Decentralized Lending Networks: Evidence from the Compound Protocol. Available at SSRN: https://ssrn.com/abstract=5380164