State
of the Art in Java-based Information Visualization on Mobile Devices
State of the Art in
Java-based Information Visualization on Mobile Devices
|
|
Christian
Osebitz, Vienna University of
Technology, Student, Vienna, Austria |
|
|||||||||||||||||||||||||||||||||||||||||||||||||||||||||||||||||||||||||||||||||||||||||||||||||||||||||||||||||||||||||||||||||||||||||||||||||||||||||||||||||||||||||||||||||||||||||||||||||||||||||||||||||||||||||||||||||||||||||||||||||||||||||||||||||||||||||||||||||||||||||||||
|
Christian
Osebitz |
|
|||||||||||||||||||||||||||||||||||||||||||||||||||||||||||||||||||||||||||||||||||||||||||||||||||||||||||||||||||||||||||||||||||||||||||||||||||||||||||||||||||||||||||||||||||||||||||||||||||||||||||||||||||||||||||||||||||||||||||||||||||||||||||||||||||||||||||||||||||||||||||||
|
Researchers often face the problem to gain an insight in their
gathered data. Information visualization can remedy this issue but in the new
area of mobile devices there is only a small knowledge base. A search on
the topic of information visualization on mobile devices revealed that it is
a relatively new and active topic, with many software libraries and expert
discussions being dedicated to it. A variety of software libraries have been
developed to visualize data on mobile applications. Examining all of these
libraries is a tedious task for software developers, who need to select an
appropriate library for their purpose without the need for extensive tests
and experimental implementations. This thesis helps developers in exploring,
comparing and selecting a charting library by functionality. After
introducing the reader to the general topic of Java-based visualization on
mobile devices an overview of state of the art libraries is given. Key
figures and key features of the libraries are discussed and compared against
each other. Based on this overview and the discussion, five libraries are selected
to conduct a detailed performance test by measuring rendering time and memory
usage on datasets having different sizes. Both measures should be taken into
consideration when choosing a library for visualizing desired volumes of data
on mobile devices. The performance test can also be used as reference implementation
of a line chart simulating a parallel coordinates
chart.
Finally, the presented libraries are compared regarding their features and
capabilities. |
|
|||||||||||||||||||||||||||||||||||||||||||||||||||||||||||||||||||||||||||||||||||||||||||||||||||||||||||||||||||||||||||||||||||||||||||||||||||||||||||||||||||||||||||||||||||||||||||||||||||||||||||||||||||||||||||||||||||||||||||||||||||||||||||||||||||||||||||||||||||||||||||||
|
State of the Art in
Java-based Information Visualization on Mobile Devices |
|
|||||||||||||||||||||||||||||||||||||||||||||||||||||||||||||||||||||||||||||||||||||||||||||||||||||||||||||||||||||||||||||||||||||||||||||||||||||||||||||||||||||||||||||||||||||||||||||||||||||||||||||||||||||||||||||||||||||||||||||||||||||||||||||||||||||||||||||||||||||||||||||
|
||||||||||||||||||||||||||||||||||||||||||||||||||||||||||||||||||||||||||||||||||||||||||||||||||||||||||||||||||||||||||||||||||||||||||||||||||||||||||||||||||||||||||||||||||||||||||||||||||||||||||||||||||||||||||||||||||||||||||||||||||||||||||||||||||||||||||||||||||||||||||||||
|
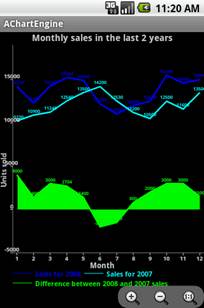
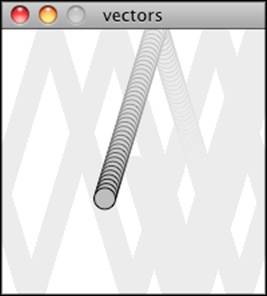
The following images are example charts provided by the product sites.
The charts are rendered with AChartEngine, Androidplot, ShinobiCharts, AFreeChart and Processing.
|
|
|||||||||||||||||||||||||||||||||||||||||||||||||||||||||||||||||||||||||||||||||||||||||||||||||||||||||||||||||||||||||||||||||||||||||||||||||||||||||||||||||||||||||||||||||||||||||||||||||||||||||||||||||||||||||||||||||||||||||||||||||||||||||||||||||||||||||||||||||||||||||||||
|
||||||||||||||||||||||||||||||||||||||||||||||||||||||||||||||||||||||||||||||||||||||||||||||||||||||||||||||||||||||||||||||||||||||||||||||||||||||||||||||||||||||||||||||||||||||||||||||||||||||||||||||||||||||||||||||||||||||||||||||||||||||||||||||||||||||||||||||||||||||||||||||
|
Results |
The search for available libraries provides the following overview of
key figures and key features of the libraries. The overview is based on the
information published on the product sites.
The number and types of charts supported by the library is one of the main
criteria to choose a library. The following table contains the types of chart
supported by the libraries.
Based on the results of the search the following libraries are
compared against each other: ·
AChartEngine ·
Androidplot ·
AFreeChart ·
ShinobiCharts ·
Processing The libraries were picked based on the number of charts supported (AChartEngine, Androidplot,AFree Chart) or based on reported high performance
(ShinobiCharts, Processing). The comparison is
based on a performance test, the measurement of the memory usage, the lines
of code used to draw a chart and a list of advantages and disadvantages for
every library. The following charts show the result of the performance test
and the measurement of the memory usage. ShinobiCharts
is excluded as it fails to handle large number of lines (
> 100). The measurement results are available in the download
section.
The following table contains the results of the detailed comparison of
the selected libraries.
Further details provided in the thesis. |
... |
||||||||||||||||||||||||||||||||||||||||||||||||||||||||||||||||||||||||||||||||||||||||||||||||||||||||||||||||||||||||||||||||||||||||||||||||||||||||||||||||||||||||||||||||||||||||||||||||||||||||||||||||||||||||||||||||||||||||||||||||||||||||||||||||||||||||||||||||||||||||||||
|
|
|
|||||||||||||||||||||||||||||||||||||||||||||||||||||||||||||||||||||||||||||||||||||||||||||||||||||||||||||||||||||||||||||||||||||||||||||||||||||||||||||||||||||||||||||||||||||||||||||||||||||||||||||||||||||||||||||||||||||||||||||||||||||||||||||||||||||||||||||||||||||||||||||
|
||||||||||||||||||||||||||||||||||||||||||||||||||||||||||||||||||||||||||||||||||||||||||||||||||||||||||||||||||||||||||||||||||||||||||||||||||||||||||||||||||||||||||||||||||||||||||||||||||||||||||||||||||||||||||||||||||||||||||||||||||||||||||||||||||||||||||||||||||||||||||||||
|
||||||||||||||||||||||||||||||||||||||||||||||||||||||||||||||||||||||||||||||||||||||||||||||||||||||||||||||||||||||||||||||||||||||||||||||||||||||||||||||||||||||||||||||||||||||||||||||||||||||||||||||||||||||||||||||||||||||||||||||||||||||||||||||||||||||||||||||||||||||||||||||