Visualize a Project Plan as a Gantt Chart
Problem
currently not available due to TU Wien budget cuts
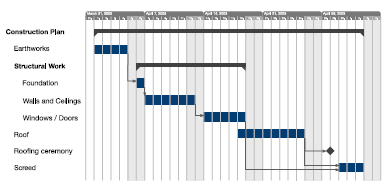 Project plans are a common example of qualitative time-oriented data. They are comprised of a different elements: activities, subactivities, milestones, and dependencies. The most common visualization for project plans are Gantt charts.
Aim
Develop a visualization prototype that loads a project plan and displays it as a Gantt chart. This prototype is built based on the visualization toolkit prefuse and a preexisting toolkit for management of time-oriented data. Project plans in MS Project and Asbru should be supported.
Other information
TimeBench: Java API for time-oriented data, information will be provided to the student.
TimeViewer: Existing visualization components for project plans.
MPXJ: Java API for MS Project files.
Asbru: Information will be provided to the student.
Information about prefuse:
- InfoVis:Wiki http://www.infovis-wiki.net/index.php?title=Prefuse
- Explore the demos in the online gallery http://www.prefuse.org/gallery/
- Download the toolkit https://github.com/prefuse/Prefuse
- Have a overview on the Prefuse classes http://prefuse.org/doc/api/
- Run the demos that come with Prefuse download.
- Read the user's manual: http://www.prefuse.org/doc/manual/ especially the introduction.
- Read and try out tutorials: