
|
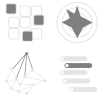
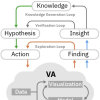
Ignacio Baltazar Pérez Messina, Marco Angelini, Davide Ceneda, Christian Tominski, Silvia Miksch, "Coupling Guidance and Progressiveness in Visual Analytics",
EuroVis 2025, 2025.
|

|
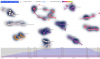
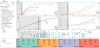
Velitchko Filipov, Davide Ceneda, Daniel Archambault, Alessio Arleo, "TimeLighting: Guided Exploration of 2D Temporal Network Projections",
IEEE Transactions on Visualization and Computer Graphics, pp. 13, 2025.
|
| |
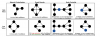
Maath Musleh, Renata Georgia Raidou, Davide Ceneda, "TrustME: A Context-Aware Explainability Model to Promote User Trust in Guidance",
IEEE Transactions on Visualization and Computer Graphics, pp. 17, 2025.
|

|
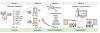
Ignacio Baltazar Pérez Messina, Marco Angelini, Davide Ceneda, Christian Tominski, Silvia Miksch, "Coupling Guidance and Progressiveness in Visual Analytics",
, pp. e70115, 2025.
paper |
|
Ignacio Baltazar Pérez Messina, Davide Ceneda, Victor Schetinger, Silvia Miksch, "Persistent interaction: A conceptualization of user-generated artefacts in Visual Analytics",
Computers & Graphics, vol. 129, pp. 104232, 2025.
paper |
|
Velitchko Filipov, Davide Ceneda, Daniel Archambault, Alessio Arleo, "TimeLighting: Guidance-enhanced Exploration of 2D Projections of Temporal Graphs",
Proceedings of the International Symposium on Graph Drawing and Network Visualization, vol. 14465, 2024.
|
|
Maath Musleh, Davide Ceneda, Henry Ehlers, Renata Georgia Raidou, "ConAn: Measuring and Evaluating User Confidence in Visual Data Analysis Under Uncertainty",
Computer Graphics Forum, pp. 18, 2024.
|
|
Davide Ceneda, Christopher Collins, Mennatallah El-Assady, Silvia Miksch, Christian Tominski, Alessio Arleo, "A heuristic approach for dual expert/end-user evaluation of guidance in visual analytics",
IEEE Transactions on Visualization and Computer Graphics, vol. 30, pp. 997-1007, 2024.
|
|
Ignacio Baltazar Pérez Messina, Davide Ceneda, Victor Schetinger, Silvia Miksch, "Persistent Interaction: User-Generated Artefacts in Visual Analytics",
EuroVis Workshop on Visual Analytics (EuroVA), 2024.
paper |

|
Ignacio Baltazar Pérez Messina, Davide Ceneda, Silvia Miksch, "Guided Visual Analytics for Image Selection in Time and Space",
IEEE Transactions on Visualization & Computer Graphics, vol. 30, pp. 10, 2024.
paper |
| |
Fabian Sperrle, Mennatallah El-Assady, Alessio Arleo, Davide Ceneda, "A Wizard of Oz Study of Guidance Strategies and Dynamics",
IEEE Transactions on Visualization and Computer Graphics, 2024.
paper |

|
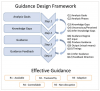
Ignacio Baltazar Pérez Messina, Davide Ceneda, Silvia Miksch, "Enhancing Visual Analytics systems with guidance: A task-driven methodology",
COMPUTERS & GRAPHICS-UK, vol. 125, pp. article no. 104121, 2024.
|
|
Ignacio Baltazar Pérez Messina, Davide Ceneda, Silvia Miksch, "A Methodology for Task-Driven Guidance Design",
EuroVis Workshop on Visual Analytics (EuroVA), pp. 6, 2023.
paper |

|
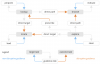
Fabian Sperrle, Davide Ceneda, Mennatallah El-Assady, "Lotse: A Practical Framework for Guidance in Visual Analytics",
IEEE Transactions on Visualization and Computer Graphics, pp. 11, 2022.
Arxiv Paper Presentation at VIS 2022 |
|
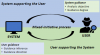
Davide Ceneda, Alessio Arleo, Theresia Gschwandtner, Silvia Miksch, "Show Me Your Face: Towards an Automated Method to Provide Timely Guidance in Visual Analytics",
IEEE Transactions on Visualization and Computer Graphics, vol. 28, pp. 12, 2022.
|
|
Christina Stoiber, Davide Ceneda, Markus Wagner, Victor Schetinger, Theresia Gschwandtner, Marc Streit, Silvia Miksch, Wolfgang Aigner, "Perspectives of Visualization Onboarding and Guidance in VA",
Visual Informatics, vol. 6, pp. 15, 2022.
|
|
Ignacio Baltazar Pérez Messina, Davide Ceneda, Mennatallah El-Assady, Silvia Miksch, Fabian Sperrle, "A Typology of Guidance Tasks in Mixed-Initiative Visual Analytics Environments",
, vol. 41, pp. 465-476, 2022.
paper |
|
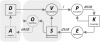
Davide Ceneda, Natalia Andrienko, Gennady Andrienko, Theresia Gschwandtner, Silvia Miksch, Nikolaus Piccolotto, Tobias Schreck, Marc Streit, Josef Suschnigg, Christian Tominski, "Guide Me in Analysis: A Framework for Guidance Designers",
Computer Graphics Forum, vol. 39, pp. 19, 2020.
|
|
Roger Leite, Victor Schetinger, Davide Ceneda, Bernardo Henz, Silvia Miksch, "COVIs: Supporting Temporal Visual Analysis of Covid-19 Events Usable in Data-Driven Journalism",
IEEE VIS 2020, short paper, 2020.
|

|
Davide Ceneda, "Guidance-Enriched Visual Analytics",
Institute of Visual Computing and Human-Centered Technology, vol. PhD, Dr.-techn., pp. 206, 2020.
|
|
Davide Ceneda, Theresia Gschwandtner, Silvia Miksch, "A review of guidance approaches in visual data analysis: A multifocal perspective",
Computer Graphics Forum, vol. 38, pp. 861-879, 2019.
|
|
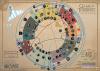
Velitchko Filipov, Alessio Arleo, Davide Ceneda, Silvia Miksch, "The Fabric of Heroes: an Infographic about Marvel Cinematic Universe",
International Symposium on Graph Drawing and Network Visualization, 2019.
|
|
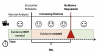
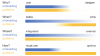
Davide Ceneda, Theresia Gschwandtner, Silvia Miksch, "You get by with a little help: The effects of variable guidance degrees on performance and mental state",
Visual Informatics, vol. 3, pp. 177-191, 2019.
|

|
Davide Ceneda, Theresia Gschwandtner, Thorsten May, Silvia Miksch, Marc Streit, Christian Tominski, "Guidance or No Guidance? A Decision Tree Can Help",
EuroVA: International Workshop on Visual Analytics, pp. 19–23, 2018.
|
|
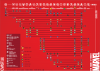
Velitchko Filipov, Davide Ceneda, Michael Koller, Alessio Arleo, Silvia Miksch, "The Circle Of Thrones: Conveying the Story of Game of Thrones Using Radial Infographics",
, 2018.
High Quality Poster |