|
Natkamon Tovanich, Raphael Arthur Buchmüller, Velitchko Filipov, Fatih Öztank, Ignacio Baltazar Pérez Messina, Sandhya Rajendran, Wolfgang Aigner, Silvia Miksch, "Visual Analytics",
Wintergraph 2026, 2026.
|
|
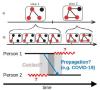
Tom Baumgartl, M. Sondag, Velitchko Filipov, Michaela Tuscher, Sandhya Rajendran, Silvia Miksch, D. Archambault, Alessio Arleo, T. von Landesberger, "Survey on Visualization of Information Diffusion over Networks",
28th Eurographics Conference on Visualization (EuroVis 2026), vol. 45/3, pp. 42, 2026.
|

|
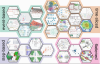
Sandhya Rajendran, Michaela Tuscher, Alessio Arleo, D. Archambault, Silvia Miksch, T. von Landesberger, Velitchko Filipov, "Happy Puzzles: Puzzle Games for Visualization Task Abstraction",
EuroVis 2026 - 28th EG Conference on Visualization, pp. 6, 2026.
|

|
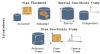
Tom Baumgartl, Mohammad Ghoniem, Tatiana von Landesberger, G Elisabeta Marai, Silvia Miksch, Sibylle Mohr, Simone Scheithauer, Nikita Srivastava, "Empowering Communities: Tailored Pandemic Data Visualization for Varied Tasks and Users",
IEEE Computer Graphics and Applications, vol. 45, pp. 130-138, 2025.
|
|
Natkamon Tovanich, Teppakorn Thanuthanad, Sandhya Rajendran, Velitchko Filipov, Silvia Miksch, Petra Isenberg, "VisConflicts: Visualizing Conflicts of Interest in Conference Reviewing",
IEEE VIS 2025, 2025.
|

|
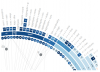
Michaela Tuscher, L. Rauchenberger, Teresa Kamencek, R. Rosenberg, Silvia Miksch, Velitchko Filipov, "A Kaleidoscopic View of Artist Co-Exhibition Networks",
IEEE VIS 2025, 2025.
|

|
Ignacio Baltazar Pérez Messina, Marco Angelini, Davide Ceneda, Christian Tominski, Silvia Miksch, "Coupling Guidance and Progressiveness in Visual Analytics",
EuroVis 2025, 2025.
|

|
Wolfgang Aigner, Silvia Miksch, Franziska Proksa, Robert Sablatnig, Markus Seidl, Waldner, Manuela, Matthias Zeppelzauer, "Visual Heritage: Visual Analytics and Computer Vision Meet Cultural Heritage (doc.funds.connect)",
18. Forschungsforum Der Österreichischen Fachhochschulen, pp. 558-559, 2025.
|
|
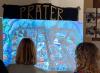
Markus Passecker, Silvia Miksch, Franziska Proksa, Wolfgang Aigner, "The past is all around you: Augmenting cultural heritage on-site",
27th EG Conference on Visualization (EuroVis 2025 ), pp. 3, 2025.
|
|
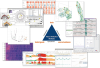
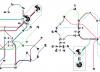
Nikolaus Piccolotto, Markus Wallinger, Silvia Miksch, Markus Bögl, "UnDRground Tubes: Exploring Spatial Data With Multidimensional Projections and Set Visualization ",
IEEE Transactions on Visualization and Computer Graphics, vol. 31, pp. 11, 2025.
paper https://osf.io/c7yga/ https://osf.io/zna3u |

|
Annika Bonerath, Claus-Christian Carbon, Silvia Miksch, Maurizio Patrignani, Alessandra Tappini, "Time-Dependent Route Planning on Maps: A User Study",
Journal of perceptual imaging : JPI, vol. 8, pp. 1-12, 2025.
|

|
Michaela Tuscher, Velitchko Filipov, Teresa Kamencek, Raphael Rosenberg, Silvia Miksch, "Nodes, Edges, and Artistic Wedges: A Survey on Network Visualization in Art History",
Computer Graphics Forum, vol. 44, pp. 33, 2025.
Supplementary Material |

|
Sanne van der Linden, Velitchko Filipov, Luise Pufahl, Silvia Miksch, Stef van den Elzen, "Towards Integrating Visual Analytics in Multi-Perspective Conformance Checking: A Call to Action",
27th EG Conference on Visualization (EuroVis 2025 ), pp. 6, 2025.
|

|
Ignacio Baltazar Pérez Messina, Marco Angelini, Davide Ceneda, Christian Tominski, Silvia Miksch, "Coupling Guidance and Progressiveness in Visual Analytics",
, pp. e70115, 2025.
paper |

|
Ignacio Baltazar Pérez Messina, Davide Ceneda, Victor Schetinger, Silvia Miksch, "Persistent interaction: A conceptualization of user-generated artefacts in Visual Analytics",
Computers & Graphics, vol. 129, pp. 104232, 2025.
paper |
|
Sandhya Rajendran, Alessio Arleo, Silvia Miksch, Michaela Tuscher, Velitchko Filipov, "Certainly Uncertain: Reintroducing Uncertainty in Visualizations",
27th Eurographics Conference on Visualization (EuroVis 2025), pp. 3, 2025.
|
|
Nikolaus Piccolotto, Fatih Öztank, Silvia Miksch, Markus Bögl, "Towards Visualization-Supported Uncertainty Elicitation",
IEEE VIS 2025, 2025.
|
|
Sandhya Rajendran, Alessio Arleo, Tatiana von Landesberger, Silvia Miksch, max sondag, Michaela Tuscher, Velitchko Filipov, "Don't Stop Me Now: Visualizing Disruptions in Railroad Networks",
IEEE VIS 2025, 2025.
|
|
Tom Baumgartl, Velitchko Filipov, Sandhya Rajendran, Silvia Miksch, Daniel Archambault, Alessio Arleo, Tatiana von Landesberger, "Layers of Doubt: Typology of Temporal Uncertainty in Dynamic Diffusion Networks",
[IEEEVIS 2025 Workshop] Uncertainty Visualization: Unraveling Relationships of Uncertainty, AI, and Decision-Making, 2025.
|
|
Markus Passecker, Victor A. de Jesus Oliveira, Paolo Buono, Silvia Miksch, Wolfgang Aigner, "Reconnecting Artifacts and Place: A Review of Situated Visualization in Cultural Heritage",
9th Workshop on Visualization for the Digital Humanities (VIS4DH 2025), pp. 7-13, 2025.
|

|
Andrea Burattin, Silvia Miksch, Shazia Sadiq, Hans-Jörg Schulz, Katerina Vrotsou, "VESPA: Visual Event-Stream Progressive Analytics",
Business Process Management 2025 International Workshops, pp. 8, 2025.
|
|
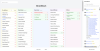
Johanna Schmidt, Bernhard Pointner, Silvia Miksch, "Visual Analytics for Understanding Draco's Knowledge Base",
IEEE Transactions on Visualization and Computer Graphics, vol. 30, pp. 392-402, 2024.
|
|
Nikolaus Piccolotto, Markus Wallinger, Silvia Miksch, Markus Bögl, "On Combined Visual Cluster and Set Analysis ",
IEEE VIS (Short Papers), 2024.
paper https://osf.io/8gxzw/ |
|
Davide Ceneda, Christopher Collins, Mennatallah El-Assady, Silvia Miksch, Christian Tominski, Alessio Arleo, "A heuristic approach for dual expert/end-user evaluation of guidance in visual analytics",
IEEE Transactions on Visualization and Computer Graphics, vol. 30, pp. 997-1007, 2024.
|

|
Claudio Di Ciccio, Silvia Miksch, Pnina Soffer, Barbara Weber, Giovanni Meroni, "Human in the (Process) Mines (Dagstuhl Seminar 23271)",
Dagstuhl Reports, vol. 13, pp. 1-33, 2024.
paper |