A Visual Analytics Approach to Segmenting and Labeling Multivariate Time Series Data
Conference Paper
|
|
| Teaser Image | |
| Author | |
| Editor | |
| Abstract |
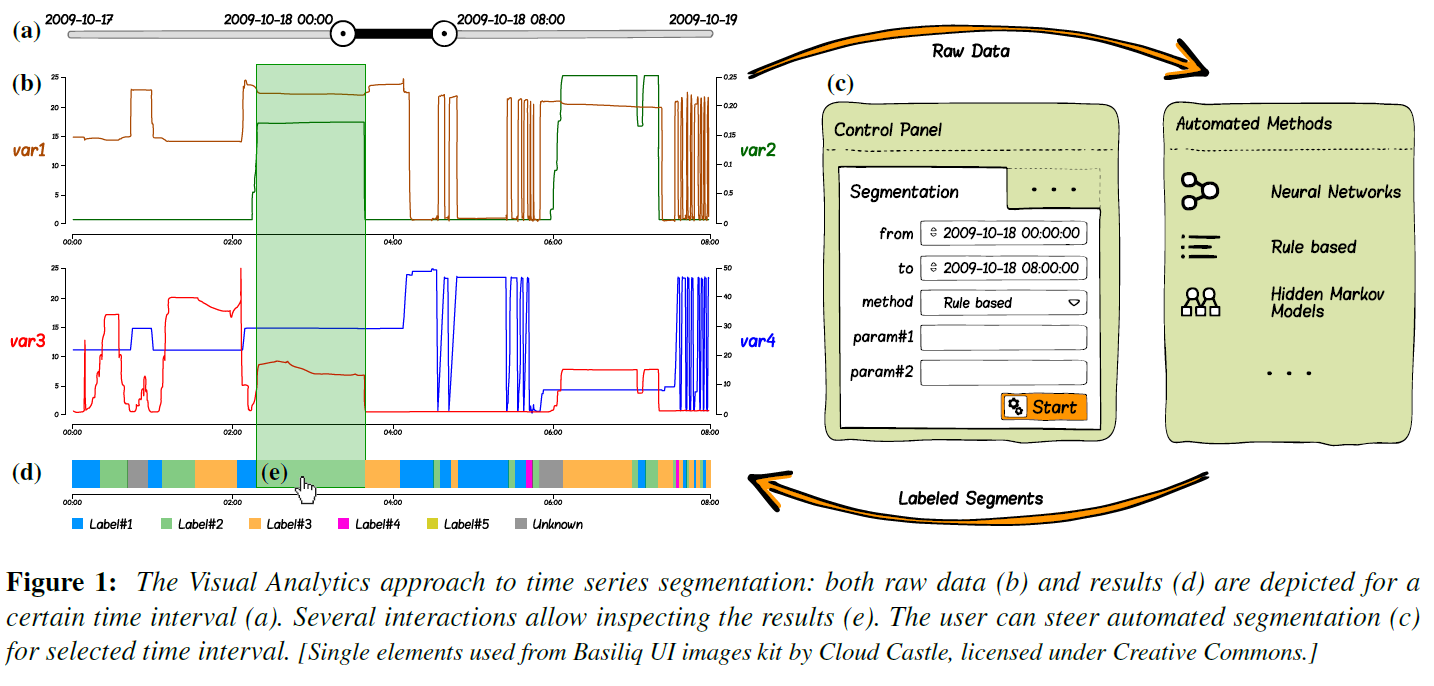
Many natural and industrial processes such as oil well construction are composed of a sequence of recurring activities. Such processes can often be monitored via multiple sensors that record physical measurements over time. Using these measurements, it is sometimes possible to reconstruct the processes by segmenting the respective time series data into intervals that correspond to the constituent activities. While automated algorithms can compute this segmentation rapidly, they cannot always achieve the required accuracy rate e.g. due to process variations that need human judgment to account for. We propose a Visual Analytics approach that intertwines interactive time series visualization with automated algorithms for segmenting and labeling multivariate time series data. Our approach helps domain experts to inspect the results, identify segmentation problems, and correct mislabeled segments accordingly. We demonstrate how our approach is applied in the drilling industry and discuss its applicability to other domains having similar requirements
|
| Keywords | |
| Year of Publication |
2014
|
| Conference Name |
EuroVis Workshop on Visual Analytics (EuroVA)
|
| Date Published |
06/2014
|
| Publisher |
Eurographics
|
| DOI | |
| reposiTUm Handle | |
| Funding projects | |
| Paper | |
| Attachments | |
| Download citation |