NEWS: Check our related work on visualizing overlapping sets if you have binary categorical variables.
Contingency Wheel++ employs novel visual analytics methods to analyze large categorical data. For details, you can read the full paper describing the work, watch the following videos and the screenshots below, and try the sofwtare demo below!
Video
Demos
Here you will find some demos based on publicaly available datasets. They will be started outside the browser using JNLP (requires Java Runtime 1.5 or later). Depending on connection speed, the loading can take up to 1 minute.
If you encounter technical problems or have feedback / new ideas to the work, or want to analyze your data with Contingency Wheel++ do not hesitate to contact me at bilal@cvast.tuwien.ac.at
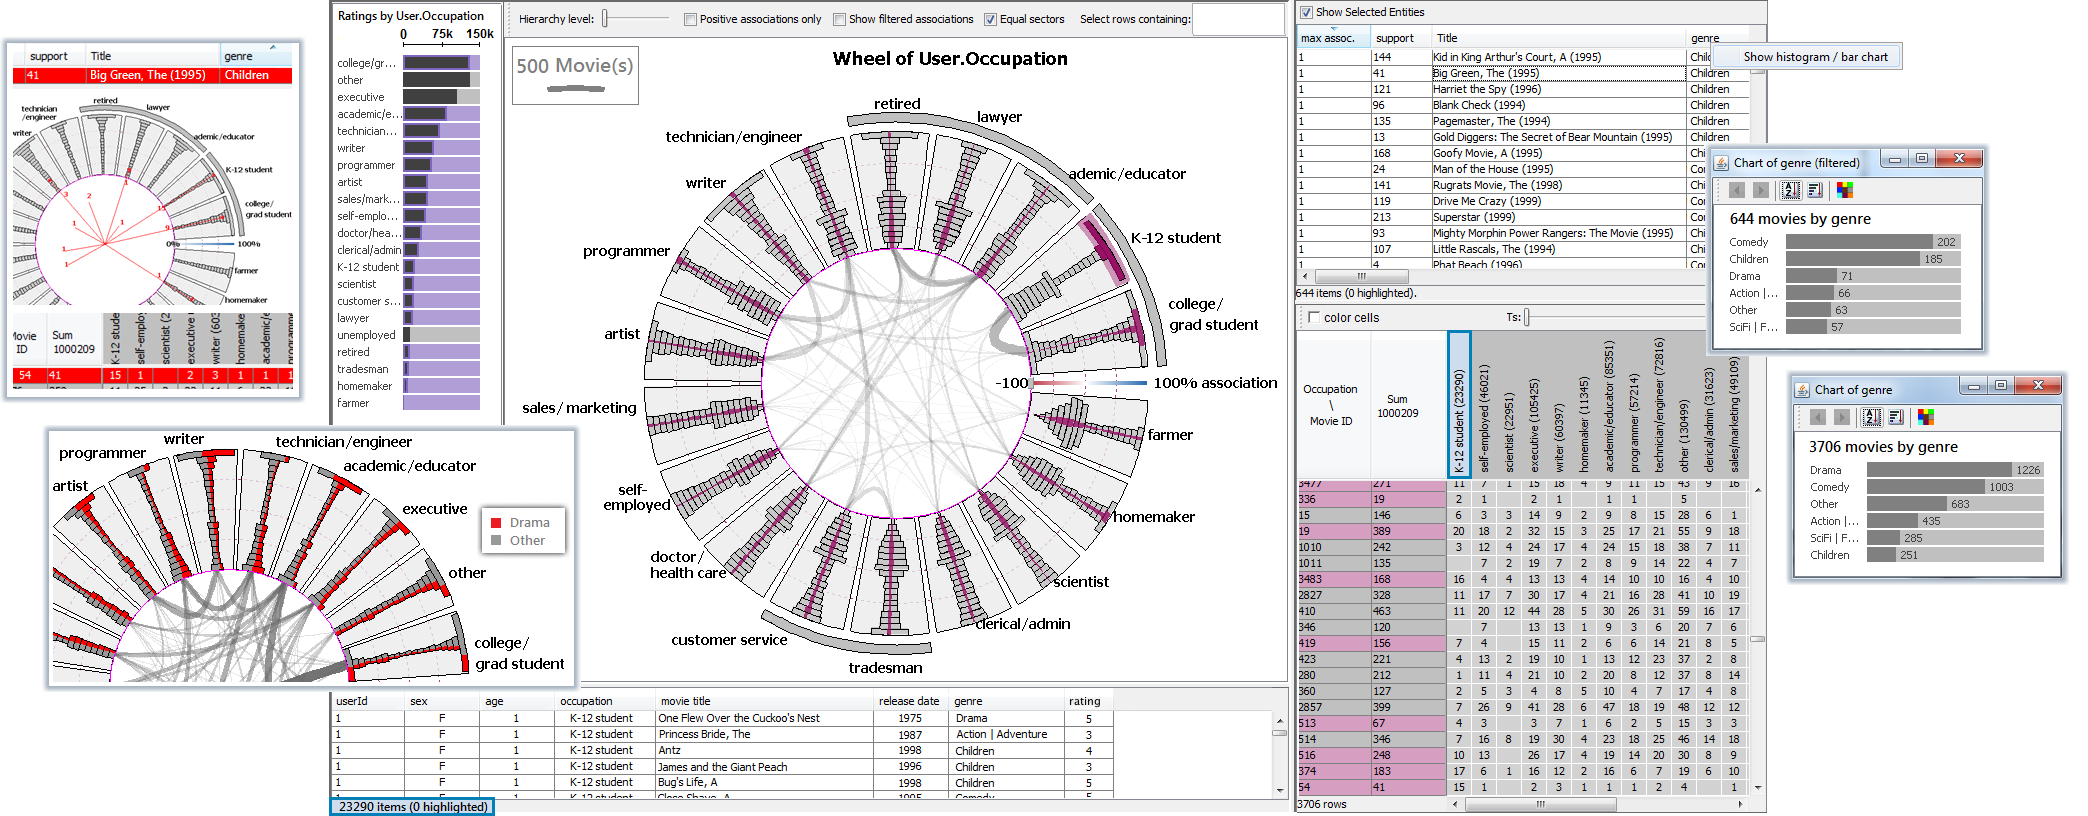
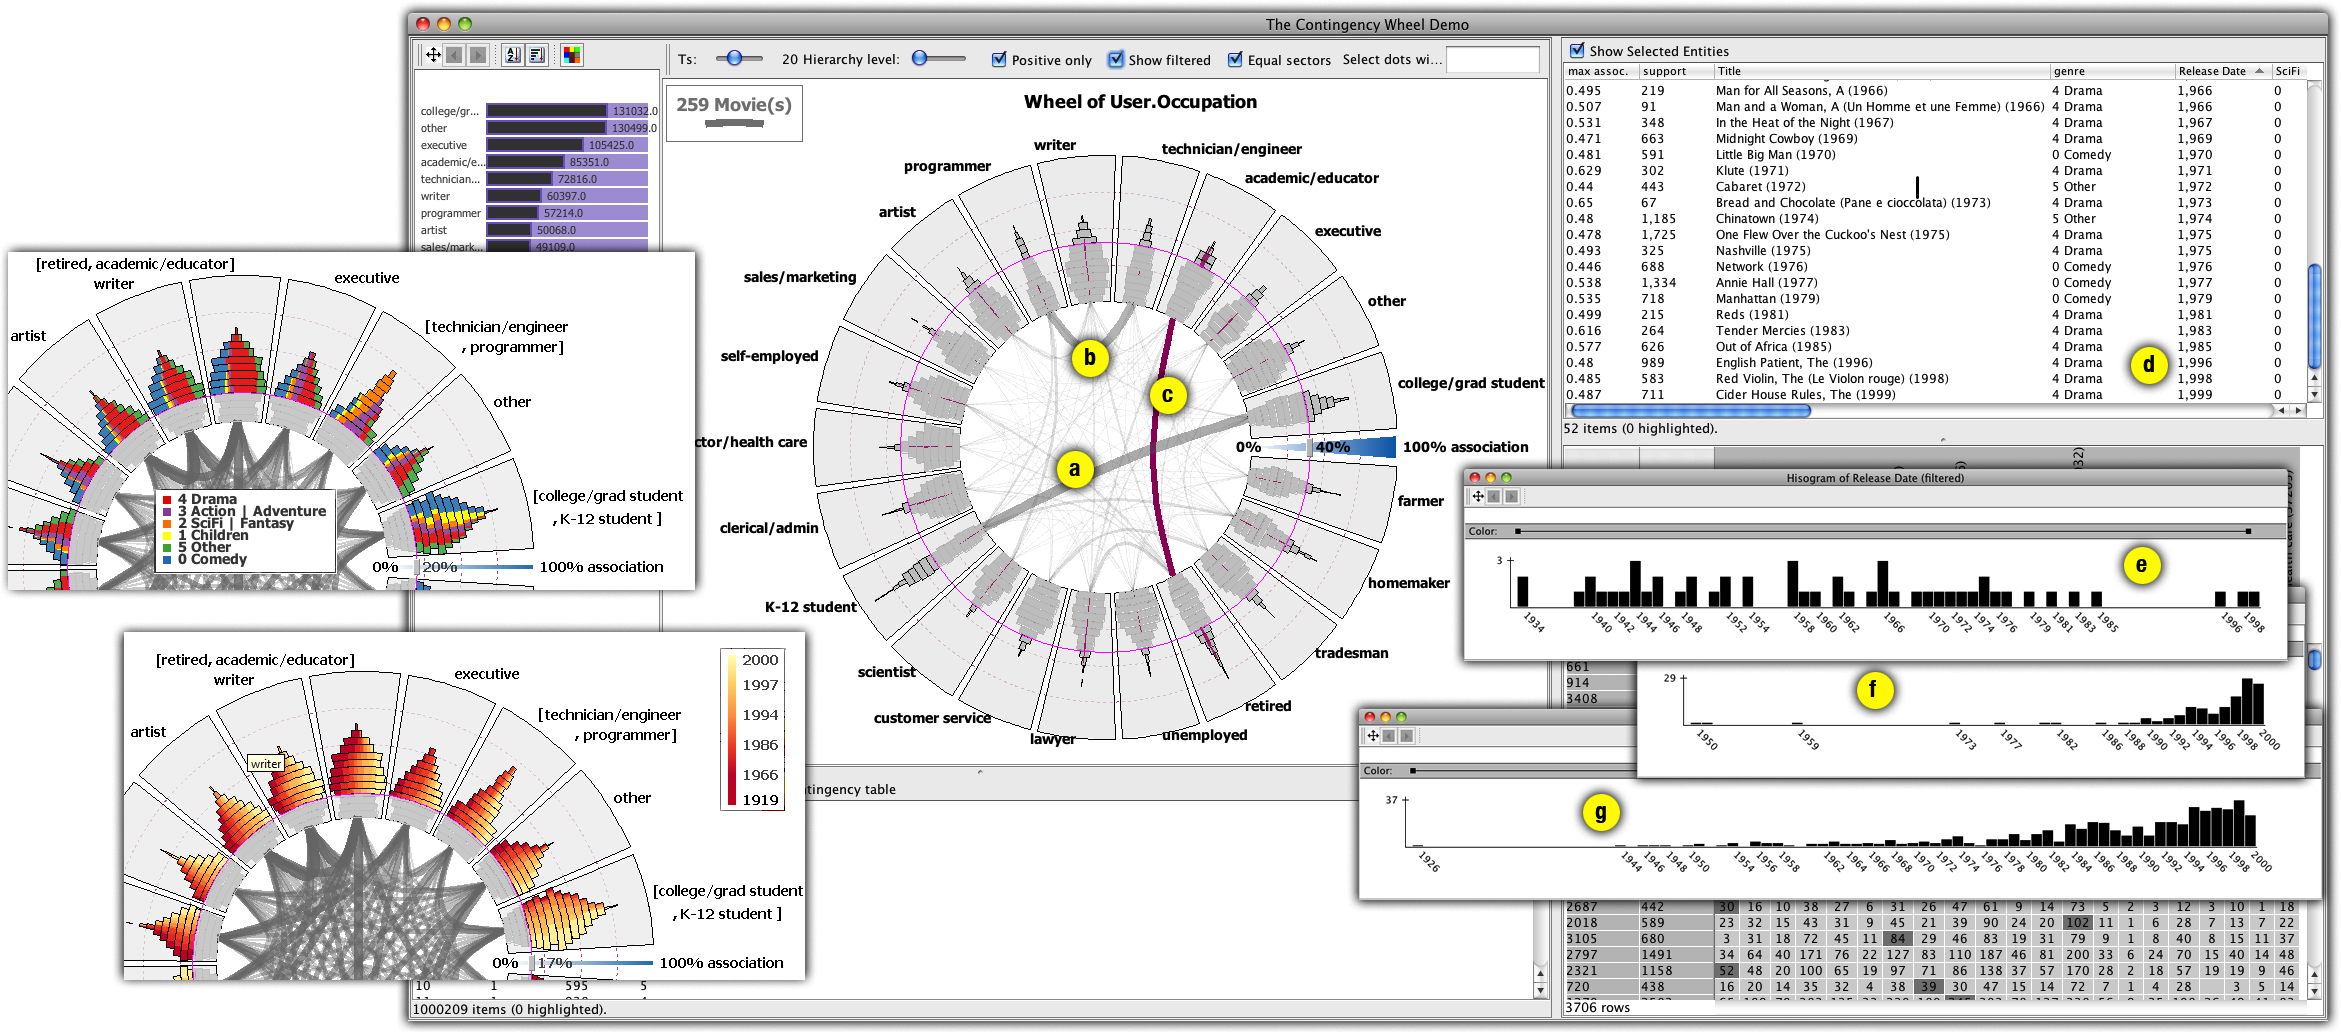
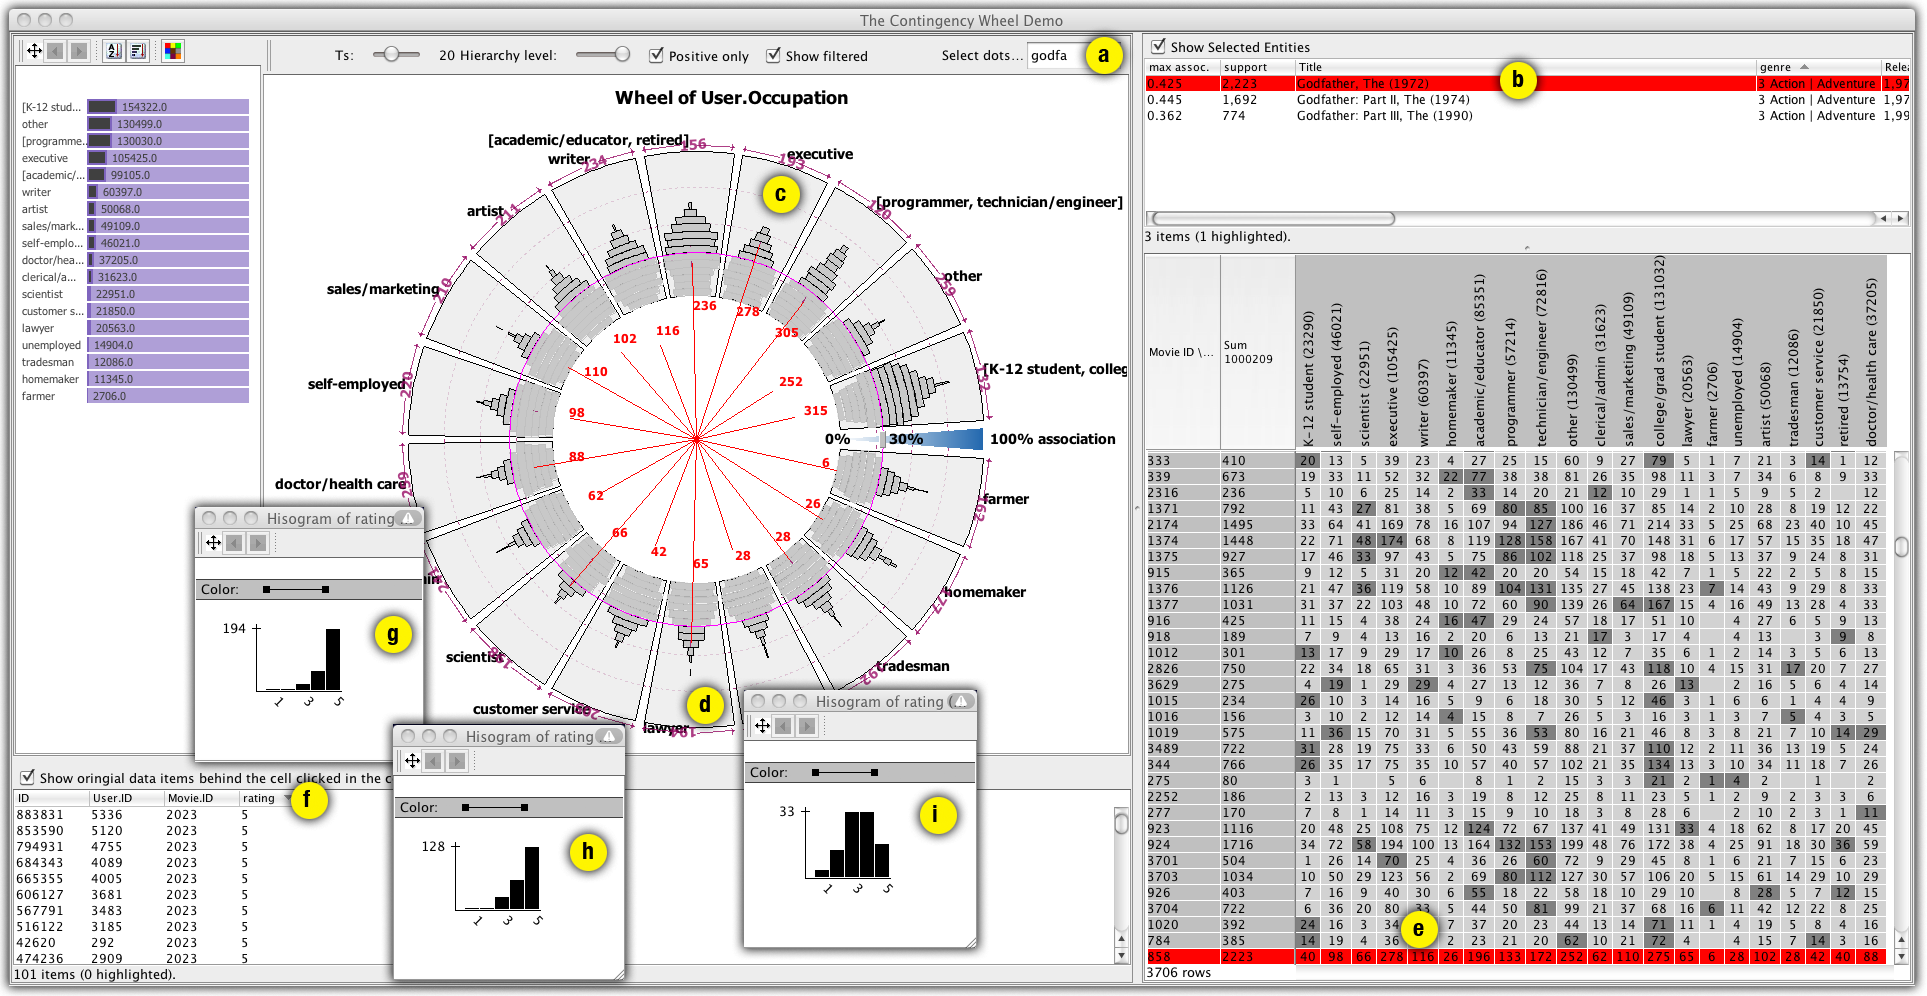
- MovieLens Demo: this demo allows you to visually analyze the MovieLens Dataset (with 1M ratings). This dataset contains 6040 users who gave about 1 million ratings for 3706 movies. After you start, you should be able to interact with two wheels (selectable from the "Wheel" menu), as described in the paper: movies x occupations and users x genres.
Start visual analysis! (total file sizes: 5.5 MB).
- BookCrossing Demo: this demo allows you to visually analyze the Book-Crossing Dataset. This set contains about 1 million ratings given by 92,107 users on 270,170 books. After you start, you should be able to interact with three wheels (selectable from the "Wheel" menu): books x countries, authors x countries and publishers x countries. In the first wheel, the sectors represent countries, and the histograms represent how the books are associated with these countries (based on the users from these countries who read and rate these books). Try to find which books are associated with which countries and why.
Start visual analysis! (total file sizes: 16 MB).
- To be continued....