VisuExplore – Gaining New Medical Insights from Visual Exploration
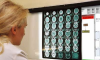
The project's objective is the implementation of a flexible, interactive visualization environment for time-oriented, medical data and information. These methods and tools will facilitate data analysis and interpretation tasks for physicians and clinical personnel in order to support medical treatment and enhance quality of care.
- Wolfgang Aigner
- Silvia Miksch
- Alexander Rind
- Thomas Turic
- Danube University Krems, Department of Information and Knowledge Engineering
- Vienna University of Technology, Institute of Design and Assessment of Technology, Research Group Human Computer Interaction
- NÖ Gesundheits- und Sozialfonds (NÖGUS)
- NÖ Landeskliniken-Holding
- Landesklinikum Krems
- systema Human Information Systems
This project was funded by the BRIDGE program of the Austrian Research Promotion Agency (FFG) (Project number: 814316) and carried out by a high-class consortium consisting of Danube University Krems, Vienna University of Technology, NÖGUS, NÖ Landeskliniken-Holding, Landesklinikum Krems, and systema Human Information Systems.
The application of modern technology in clinical practice leads to a massive increase in quantity and complexity of electronically acquired medical data and information. Current commercial clinical information systems are faced with the explosion of available medical data and users of these systems ask for alternative, more intuitive solutions.
Interactive visual representations can be used to avoid information overload and to make information from multiple heterogeneous data sources more comprehensible. Especially in the medical domain time-oriented data plays a central role. These representations encompass changes of patients' condition, therapeutic actions, interventions, and measures as well as trends, patterns, and relationships between these variables over time.
Central to the visualization of medical data is not the presentation or graphical rendering but the gaining of new insights and knowledge from intensive active examination of the collected data and information. Static visualizations do not support such an analytical process because they allow for passive viewing only. Visual exploration requires flexible methods for interaction and manipulation.
The project VisuExplore had been initiated by Silvia Miksch and aimed at the development of such methods and tools. The project's objective was to provide flexible and interactive visualization environments for time-oriented, medical data and information. These methods and tools should facilitate data analysis and interpretation tasks for physicians and clinical personnel in order to support medical treatment and enhance quality of care. Throughout the project, we developed the two research prototypes VisuExplore and TimeRider for two different application scenarios:
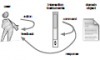
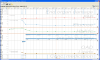
VisuExplore is a flexible interaction and visualization framework for an electronic health record of a single patient. It presents the development of multiple heterogeneous medical variables over time. A particular focus was set on a high level of usability by using simple and easy-to-understand visual representation methods. In addition, VisuExplore is an extensible platform for further research developments. For example, three further visual representation methods were implemented and integrated during the project: a semantic zoom chart (based on [Bade et al., 2004]) to combine quantitative data (e.g., body temperature) and qualitative abstraction thereof (e.g., “high fever”), a horizon graph (based on [Reijner, 2008]) for a particularly space-efficient display of large amounts of numerical variables, and a document browser.
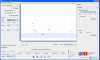
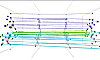
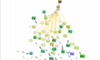
TimeRider uses and extends animated scatter plots for the analysis of patient cohorts over time. Thereby, we studied the use of animation, which is an important visualization alternative to time axes. Furthermore, we had to tackle additional challenges in order to explore patient cohorts effectively.
We succeeded in cooperating with physicians and involving them in the design and development process. Thus, we could base the interaction and visual representation methods on medical requirements and evaluate them in practice. This is an important prerequisite for usable and useful outcomes, but is often not achieved when facing the workload of clinicians.
In the evaluation of VisuExplore, we accumulated important scientific results, which are not only relevant for our prototype but also for comparable interaction and visual representation methods. For example, our subjects preferred familiar visual representations to more innovative methods. Furthermore, they applied largely diverging strategies to gain insights. This implies that a visual interface with a large repertoire of alternative interaction methods serves them better. In addition to usability issues, we gained important insights about users' cognitive strategies.
Related Work:
- LifeLines for Visualizing Patient Records
- MIVA – Medical Information Visualization Assistant
- MIDGAARD – Connecting Time-Oriented Data and Information to a Coherent Interactive Visualization
- TimeViewer – Visualizing Temporal Data using prefuse
- Semantic Zoom of Time-oriented Quantitative Data
- HorizonVis – Interactive Visual Exploration of Multivariate Medical Measurements in Diabetes Care
- TimeRider – Visualizing Patient Cohorts by Animated Scatter Plots