PlanViewer - Treating Temporal Uncertainties of Complex Hierarchical Data Visually


This work is an attempt to apply PlanningLines in a modern and highly sophisticated visualization which treats MS-Project plans as well as medical treatment plans written in Asbru. To do this, a Java prototype was developed which follows some general paradigm of the scientific discipline Information Visualization. The application implements several visualization techniques which support the representation of plans.
- Andreas Fellner,Vienna University of Technology, Institute of Software Technology and Interactive System, Vienna, Austria
- Wolfgang Aigner, Vienna University of Technology, Institute of Software Technology and Interactive System, Vienna, Austria
- Silvia Miksch, Vienna University of Technology, Institute of Software Technology and Interactive System, Vienna, Austria
The visualization was developed with two open-source toolkits: The InfoVis Toolkit and Prefuse. The InfoVis Toolkit provides a memory saving data table used to store abstract data, prefuse is the base framework for all graphical issues.
The application was developed in the scope of a thesis about temporal uncertainties in plans. Generally, there are three ways on how to treat temporal uncertainties:
-
reactive way: The plan does not consider any uncertainties. In case of violating temporal constraints during execution, a re-planning is done from this point on.
-
progressive way: Planning is done until the first expected temporal uncertainty is reached, then the execution starts. Whenever this point is reached, the next section of the plan will be created.
-
proactive way: This approach tries to consider each possible temporal uncertainty before it actually occurs. Temporal uncertainties flow into the plan itself.
Especially, the proactive way is of special interest. There are several ways to consider temporal uncertainties beforehand, like analytical methods or bringing some flexibility into the plan.
The most common charting technique to create flexible plans is PERT. Flexibility is obtained by using start and end-intervals instead of fixed time-points. Nevertheless, as all temporal aspects are only provided textually, problems or over-dimensioned slack time may not be recognized at a glance.
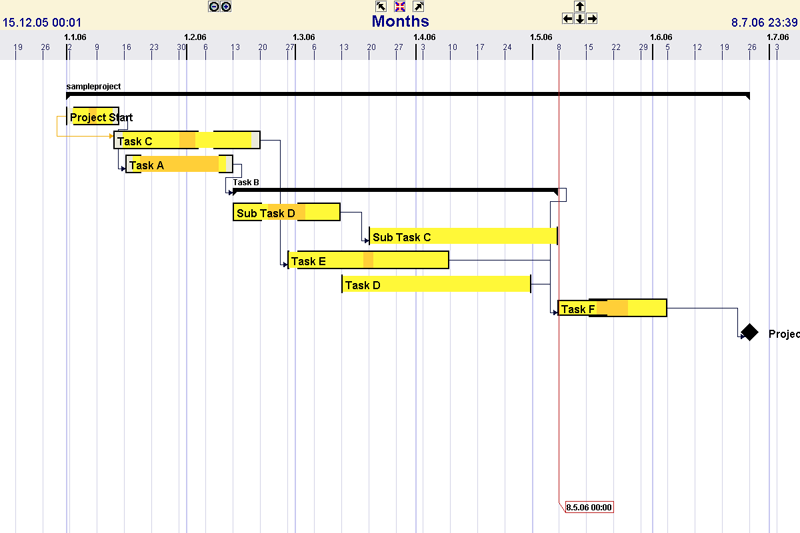
A graphical solution for flexible plans is the concept PlanningLines. It can be seen as a combination of PERT and Gantt charts. Instead of single rectangular bars as used in Gantt, complex glyphs (a single PlanningLine) are applied to each task. Such a glyph represents the typical data of a common PERT task visually.
The PlanViewer application is able to represent MS-Project and Asbru plans with this concept. In contrast to MS-Project plans, an Asbru plan already considers the temporal aspects of PlanningLines. But, as a MS-Project plan provides a lot of fields that can be filled with own information, certain fields are used to store missing attributes.
Additionally, PlanViewer combines PlanningLines with methods and techniques of Information Visualization. An Information Visualization amplifies the cognition and perception of complex information. In case of temporal uncertainties within a plan, the task of an Information Visualization is to communicate these complex coherencies to users so they are able to understand them and see possible problems at a glance.
The most important techniques realized in PlanViewer are:
-
Zoomable GUI: The user has the opportunity to watch a plan or parts of it in different levels of detail. The range of zooming reaches from several milliseconds to years.
-
Panable GUI: Panning allows an intuitive navigating to any position of a plan. Additionally, some buttons allow to navigate to the begin or end of a plan, or resets the view so the whole plan is visible.
-
Semantic Zooming: A task is only shown as PlanningLine when a certain dimension is reached. If a task is too small a representation as PlanningLine makes sense, the existence of it is shown as small rectangle.
-
Tooltips: Each task but also the time-cursor provides a tooltip that communicates the most important temporal aspects textually too.
-
Expandable Tasks: A hierarchically decomposed task can be expanded/collapsed on demand. So, areas a user is interested in can be displayed very detailed, while surrounding areas are only shown as composited tasks.
Besides displaying a plan by using PlanningLines, also LifeLines can be chosen as notation. Furthermore, two different modes to display hierarchical decomposition are supported. The behaviour of the prototype if configurable with a configuration file. Further, the application is designed to be embedded in other applications as part of a plan viewing or authoring tool.
Downloads
>> Download PlanViewer prototype (executable jar)
Needed application: Java JRE 1.4.2
Size: 8.4 MB
>> Download MS Project example plans
Needed application: PlanViewer or MS Project
Size: 204 kB
>> Download Asbru example plans
Needed application: PlanViewer or AsbruView
Size: 92 kB
>> Download PlanViewer prototype (complete src+jar+doc)
Needed application: Java JRE 1.4.2
Size: 31.1 MB
Papers
A. Fellner: Treating Temporal Uncertainties in Complex Hierarchical Data; Master's Thesis, Supervisor: S. Miksch and W.Aigner; Institut für Softwaretechnik und Interaktive Systeme, 2006.
W. Aigner, S. Miksch: Communicating the Logic of a Treatment Plan Formulated in Asbru to Domain Experts; in: Computer-based Support for Clinical Guidelines and Protocols, K. Kaiser, S. Miksch, S. Tu (ed.); IOS Press, 101 Studies in Health Technology and Informatics (2004), ISBN 1 58603 412 X; 1 - 15.
W. Aigner: Interactive Visualization of Time-Oriented Treatment Plans and Patient Data; Master's thesis, Supervisor: S. Miksch; Institut für Softwaretechnik und Interaktive Systeme, 2003.
Related Work
- Zoomable TimeView (Demo of a zoomable version of "PlanningLines")
- LifeLines for Visualizing Patient Records (C. Plaisant et al. - University of Maryland)