In this project we support medical experts in exploring patients' conditions as well as the effects of clinical actions on patients' conditions.
We are dealing with sequences of various patient parameters in combination with clinical activities defined in a treatment plan.
The multivariate data can be characterized as follows:
Patient parameters
Quantitative, continuously measured, abstract, time-stamped data that refer to states
Treatment plan
Qualitative (nominal), abstract, time-stamped data that refer to events
The task can be described as exploring the effects of clinical actions on a patient’s condition.
Questions arising can therefore be stated as follows:
- How did the patient’s condition change after a certain clinical action?
- What was the effect of a certain clinical action?
- When applying a certain clinical action – is the effect always the same or can is it possible to identify patterns?
- Is the effect of a clinical action the same as for other patients?
- What clinical action improved/downgraded a patient’s condition?
- When is a patient in a critical condition?
The intended users of the system are medical experts and physicians.
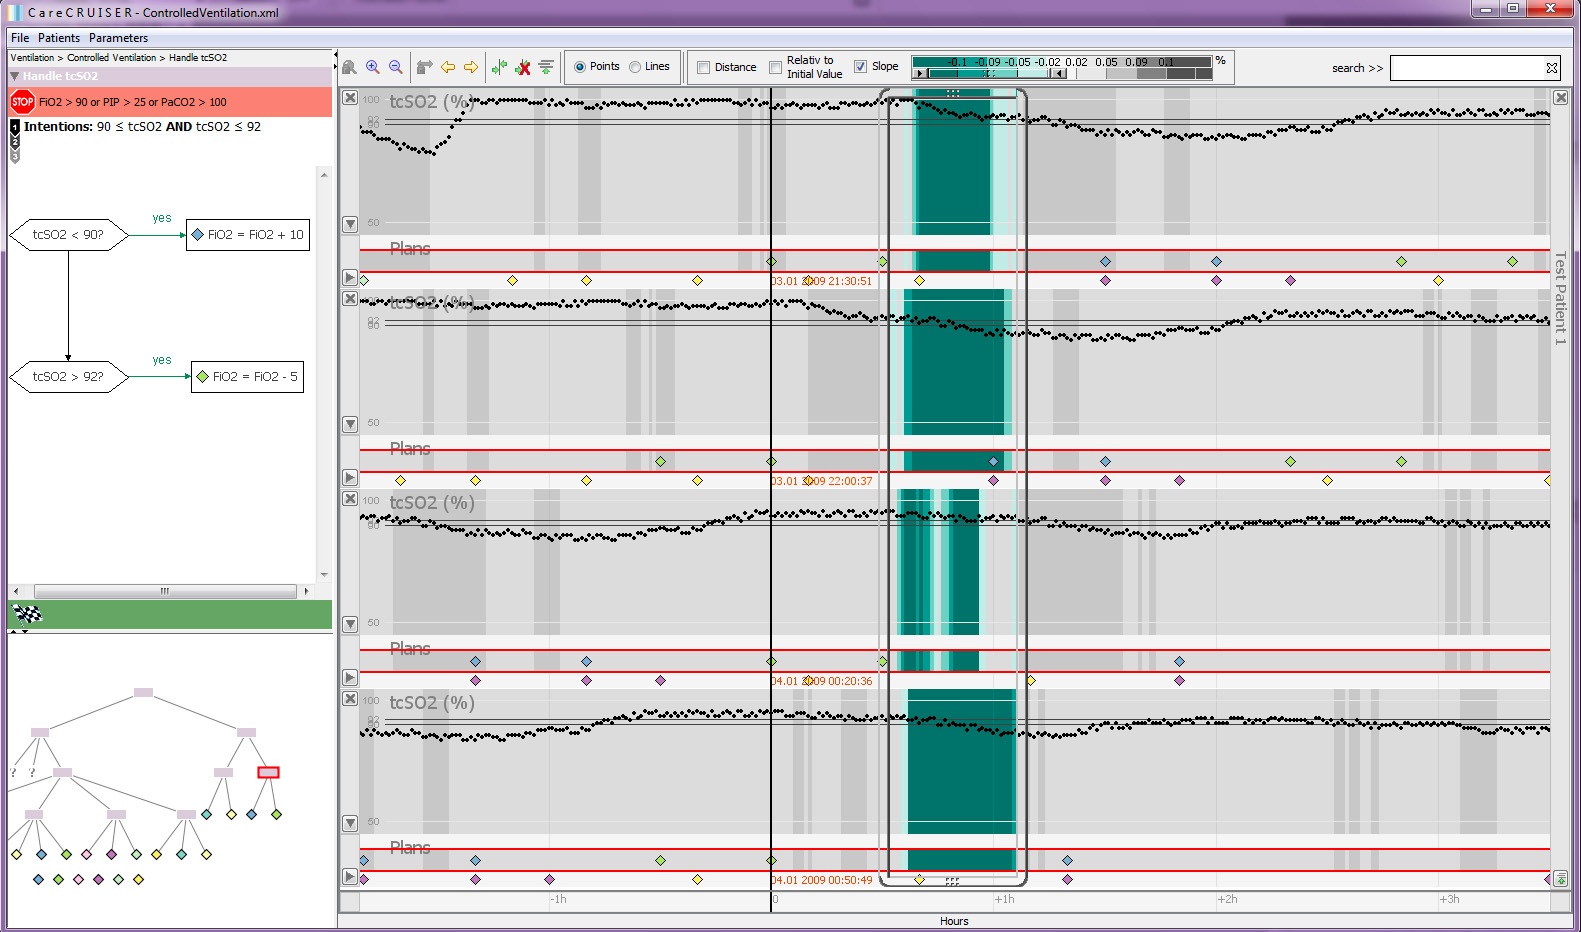
For the comparison task described above we provide the ability to change the spatial arrangement of the data (e.g., by aligning clinical treatment plans vertically).
To support the localization and lookup of specific curve events (e.g., critical values or extreme drops or rises) we provide a range slider for the color scheme to filter for such events.
Using a focus window the user is supported in investigating a specific region of the treatment. The focus window grays out the color-information outside its borders and the user can look for noticeable vertical color-patterns.
We deal with linear representation of time and abstract data.
We can define the following tasks to be accomplished:
- Visualizing individual values of parameters and activities
- Identifying effects of clinical activities and the patient’s condition
- Localization of drops and rises of parameter values, good/bad condition of a patient
- Comparing effects of a clinical activity
- Lookup activities that worsen/improved a patient’s condition
We map time on a 2-dimensional, static representation. Out of this we were able to define the following visualization methods:
We use line and point plots for visualizing the patient parameters. Furthermore, different color schemas are provided to highlight interesting portions of the development of a parameter:
- Highlighting the distance of the actual values to the specified intended value to help to localize critical values,
- Highlighting the process of the actual values relative to the initial value to show to what extent the applied treatment plan has the intended effect, and
- Highlighting the slope of a value to help to explore the immediate effects of applied clinical actions.
We use classification methods to determine which value is above, equal, below the intended value range.
The CareCruiser Prototype
We combined the visualization, analytical, and interaction methods into the CareCruiser prototype.