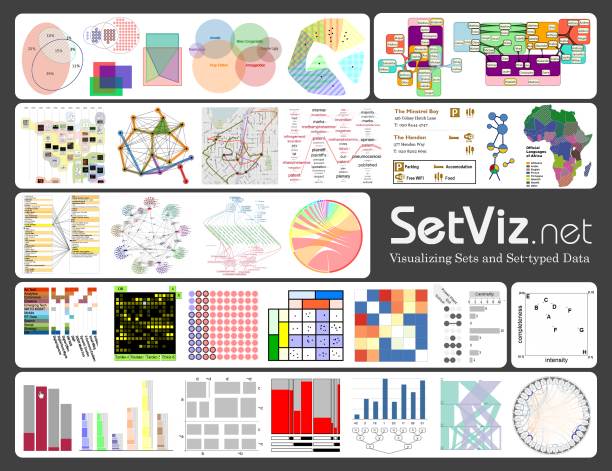
Visualizing Sets and Set-typed Data
Software Tools, Demos, Videos, and Conference Slides
Companion website for our survey on set visualization, published in Computer Graphics Forum ( pdf).
pdf).
A graphical list of set-related tasks is available here.
A printable and more comprehensive list of the resources is available in PDF as supplementary material of the survey.
NEW: The slides of our EuroVis 2014 talk are available here (in Powerpoint format).
New: a publication browser of the surveyed techniques is available here.
New: another publication browser of the surveyed techniques is available here (by Adil Yalçın).
Note: we appreciate if you refer us to related material and techniques for set visualization that we missed, also we welcome your feedback or proposals to our work (contact Bilal Alsallakh or Luana Micallef)
| All the material on this page is licensed under a Creative Commons Attribution-ShareAlike 3.0 Unported License. |
Venn and Euler Diagrams
eulerAPE
- Authors: Luana Micallef, Peter Rodgers
- Software: open-source
eulerGlyphs
- Authors: Luana Micallef
- Software: open-source
eulerForce
- Authors: Luana Micallef, Peter Rodgers
- Software: open-source
3-Circle Venn Diagram Applet
- Authors: Stirling C. Chow, Peter Rodgers
- Software: Java Applet
Wilkinson’s venneuler()
- Authors: Leland Wilkinson
- Software:
- R + Java code
- online JavaScript prototype, sourcecode on GitHub (by Ben Frederickson)
d3venn: Venn Diagrams with D3.js
- Authors: Helen Lu
- Software: sourcecode on GitHub
Venn Diagrams with Processing.js
- Authors: Ben Frederickson
- Software: online JavaScript prototype
EulerView
- Authors: Paolo Simonetto, David Auber, and Daniel Archambault
- Software: a plugin for the open-source Tulip toolkit
Variants of Euler Diagrams
Untangling Euler Diagrams
- Authors: Nathalie Henry Riche and Tim Dwyer
- Video: Demonstrating Interaction
- Talk: at InfoVis 2010
Fan Diagrams
- Authors: Bohyoung Kim, Bongshin Lee, and Jinwook Seo
- Software: Windows Executable (see the user manual)
- Talk: Poster at InfoVis 2006
- Website
Overlays
Region-based
Bubble Sets
- Authors: Christopher Collins, Gerald Penn, Sheelagh Carpendale
- Video: demonstrating interaction
- Software:
- open-source java implementation using Prefuse
- Stand-alone java imlementation (by Josua Krause)
- D3 implementation (by Johnathan Mercer)
- D3 implementation (by Josua Krause) - work in progress (unstable)
- Talk: at InfoVis 2009, coming soon (vimeo)
- Website
eXamine
- Authors: Kasper Dinkla, Mohammed El-Kebir, Cristina-Iulia Bucur, Marco Siderius, Martine J Smit, Michel A Westenberg, Gunnar W Klau
- Video: demonstrating interaction
- Open access article
DiTop
- Authors: D. Oelke, H. Strobelt, C. Rohrdantz, I. Gurevych, and O. Deussen
- Video: demonstation
- Software: Open Source implementation on the website
- Website
VizSter
- Authors: Jeffrey Heer, and Danah Boyd
- Video: demonstation
- Software: download prototype (open source)
Line-based
LineSets
- Authors: Basak Alper, Nathalie Henry-Riche, Gonzalo Ramos, and Mary Czerwinski
- Video: demonstation
Kelp Diagrams
Parallel Tag Clouds
- Authors: Collins, Christopher, Fernanda B. Viegas, and Martin Wattenberg
- Video: demonstation
- Website (including the paper and the IEEE VAST 2009 slides)
KelpFusion
- Authors: Wouter Meulemans, Nathalie Henry Riche, Bettina Speckmann, Basak Alper, Tim Dwyer.
- Video: demonstating interactivity with the thresholds
- Talk: coming soon
Glyph-based
searchCrystal
- Authors: Anselm Spoerri
- Video: demonstation
- Software: Adobe Flash demo
Node-Link Representations
Jigsaw
- Authors: John Stasko et al.
- Video: List view in Jigsaw
- Software: download
PivotPaths
- Authors: Marian Dörk, Nathalie Henry Riche, Gonzalo Ramos, and Susan Dumais
- Video: Demonstrating Interaction
- Software: interactive demo
Eyediagram
- Authors: Jose Caldas, Nils Gehlenborg, Ali Faisal, Alvis Brazma, and Samuel Kaski
- Video: Demonstrating Interaction
- Software: interactive demo (source code).
- Project homepage
Matrix Representations
AggreSet
- Authors: M. Adil Yalçın , Niklas Elmqvist, and Ben Bederson
- Video: overview
- Software: web-based prorotype
ConSet
- Authors: Bohyoung Kim, Bongshin Lee, and Jinwook Seo
- Video: overview
- Software: Windows Executable (see the user manual)
- Poster at InfoVis 2006
OnSet (PixelLayers)
- Authors: Ramik Sadana, Tim Major, John Stasko
- Video: overview
- Software: web-based prorotype
- Project homepage
- Talk at InfoVis 2014
Frequency Grids
- Authors: Luana Micallef, Pierre Dragicevic, Jean-Daniel Fekete
- Software: eulerGlyphs (open source)
KMVQL (Boolean Query Specification and Query Result Visualization)
- Authors: Jiwen Huo
- Poster: Vis 2003
UpSet
- Authors: Alexander Lex, Nils Gehlenborg, Hendrik Strobelt, Romain Vuillemot, and Hanspeter Pfister
- Video
- Software: open-source web-based prototype
- Website
- Talk at InfoVis 2014
Aggregation-based Techniques
Double-Decker Plot
- Authors: Heike Hofmann, A Siebes, A Wilhelm
- Software:
Parallel Sets
- Authors: Fabian Bendix, Robert Kosara, and Helwig Hauser
- Software:
Linear Diagrams
- Authors: Peter Rodgers
- Software:
Radial Sets
- Authors: Bilal Alsallakh, Wolfgang Aigner, Silvia Miksch, and Helwig Hauser
- Video: the visual and interaction metaphors
- Software: interactive demos
- Slides: InfoVis 2013
UpSet
- Authors: Alexander Lex, Nils Gehlenborg, Hendrik Strobelt, Romain Vuillemot, and Hanspeter Pfister
- Video
- Software: open-source web-based prototype
- Website
Singleton Set Distribution View
- Authors: Kent Wittenburg, Alessio Malizia, Luca Lupo, Georgiy Pekhteryev
- Slides: AVI 2010
Theses on Set Visualization
2014: Visual Analytics of Large Homogeneous Data - Categorical, Set-typed, and Classification Data
Bilal Alsallakh, PhD Thesis at Vienna University of Technology
2013: Visualizing Set Relations and Cardinalities Using Venn and Euler Diagrams
Luana Micallef, PhD Thesis at the University of Kent
2012: Visualisation of Overlapping Sets and Clusters with Euler Diagrams
Paolo Simonetto, PhD Thesis at Université Bordeaux 1
Download thesis
2008: Set Type Enabled Information Visualization
Wolfgang Freiler, Master’s thesis at Vienna University of Technology
Download thesis
2007: Generating and drawing area-proportional Euler and Venn diagrams
Stirling C. Chow, PhD Thesis at the University of Victoria.
Download thesis

