Empirical Evaluation of a Visualization Technique with Semantic Zoom
Problem
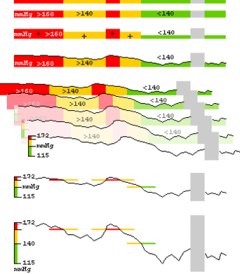 Multivariate, time-oriented data plays a central role in many domains such as medicine, finance, or environmental engineering. Information Visualization can be an instrument to make such vast data sets intuitively comprehensible. As the number of time series increases, visualizations need to be space-efficient. We have developed a visualization widget that adds qualitative abstractions to quantitative data, so that users can spot important developments even if the visualization has a small height. For example, the figure on the right demonstrates how a line graph of systolic blood pressure shrinks until only color encodes increased (yellow) and critical (red) values. A systematic evaluation is needed to assess the effectiveness of this technique.
Aim
Perform a controlled experiment to compare our semantic zoom visualization and another visualization technique for multivariate, time-oriented data.
Other information
http://ieg.ifs.tuwien.ac.at/projects/semzoom/
Contact
Further information
Stephan Hoffmann